Distance
I’ve been logging my cycling data for the past 7 years and have ridden over 98,500 km in that time. That is almost 2.5 times around the Earth, or an average of 38.5 km (24 miles) per day. In this post, I analyze the distance I rode each year, assess the variation between different months of the year, look at my longest and most mountainous rides, and show how much of the world I’ve covered by bike.
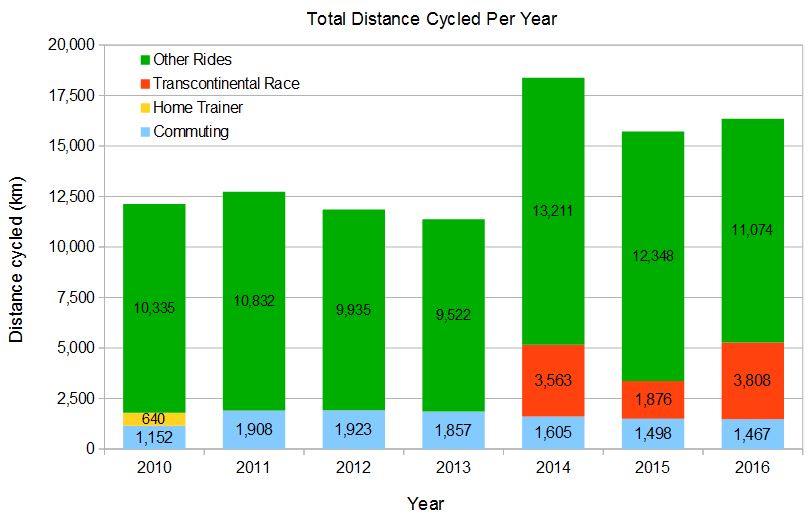
About 11,500 km of this distance was done commuting and running errands around town (I manually entered the approximate total for this each week rather than recording each of those rides individually), plus I did 640 km on a home trainer in 2010 (I sold the home trainer once I got better winter clothing). You can see the distance per year for each type of cycling in the graph above. The distance that I rode during the Transcontinetal Race (TCR) in 2014-16 is also separated from other rides; the 2015 TCR distance is shorter than the others because I scratched from the race.
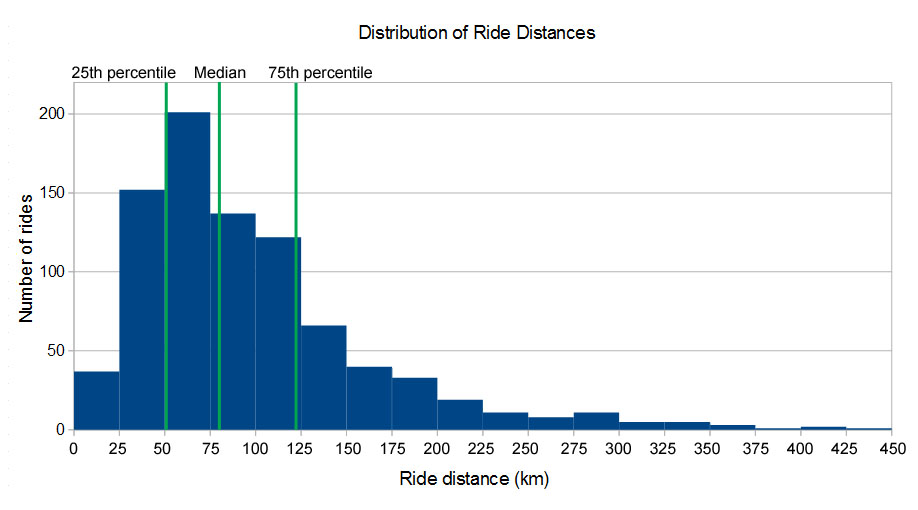
The 86,500 km that were not commuting or on the home trainer were spread over 888 rides. Due to the skewed distribution shown in the graph below, the median of 81 km is the most approriate measure of central tendency, meaning that 50% of my rides were longer than 81 km and 50% were shorter. In addition, one quarter of my rides were longer than 121 km (the 75th percentile) and one quarter were shorter than 51 km (25th percentile).
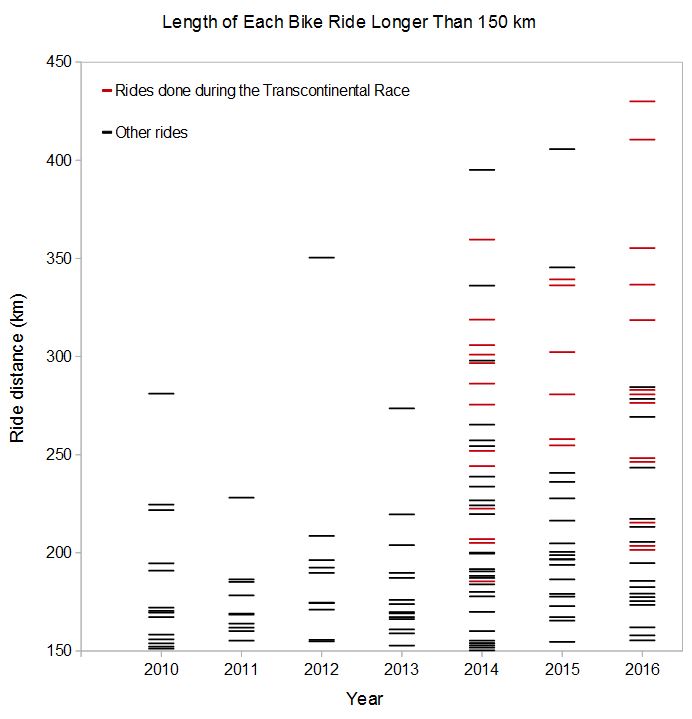
Each ride longer than 150 km is shown as a line in the graph below, with rides done during the Transcontinetal Race shown in red. Since 2010, I’ve done 66 rides longer than 200 km, including 17 above 300 km, with the longest distance ridden within a 24-hour period being 430 km during the first day of the 2016 Transcontinental Race (from Flanders to the Loire Valley). I did a 500 km-long ride during training in 2014 (from Paris to Basel), but that took more than 24 hours so I’ve now split it into two rides.
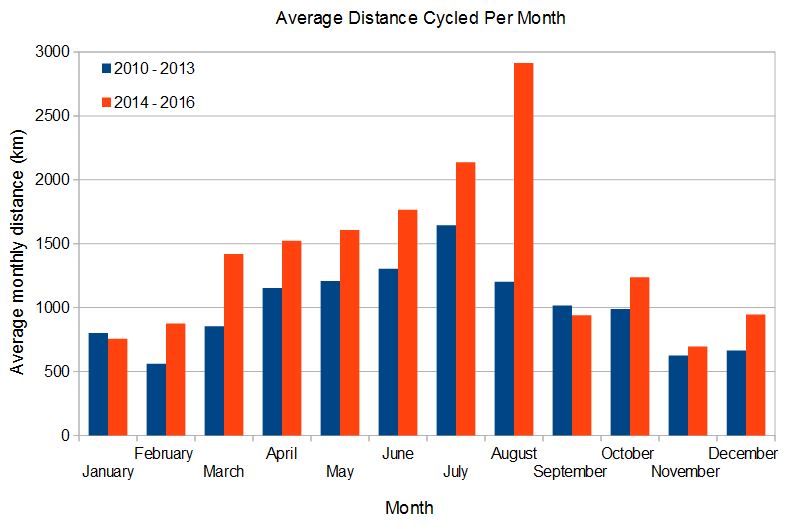
In addition to looking at the data across different years, it’s informative to look at the averages for each month of the year, which is shown in the next graph. The effect of the northern-hemisphere summer is obvious, but I rode slightly more in December and January than the other winter months because of the extra holiday time; I also once benefited from a southern-hemisphere summer when my wife and I went tandem-touring in New Zealand in December and January. The distance ridden when commuting and running errands around town is far less seasonally-dependent and accounts for about 100-150 km of each month’s total.
A slightly different distribution is apparent for the years during which I did the TCR (the red bars) compared to previous years (the blue bars). My TCR training increased from March to July, then the race was in late July and August, followed by a return to a more normal pattern in September.
Elevation Gain
The amount of height/elevation gained can be more important than the distance ridden on certain rides. Because I live in Switzerland, even my flatter rides are reasonably hilly, and my tough rides can be seriously mountainous. Since the start of 2010, I’ve climbed a total of 1,476,000 meters, or 1,476 km, which is almost four times the orbiting height of the International Space Station (which is at 380 km). The median amount of climbing per ride was 1,070 meters. In terms of the rate of climbing, I’ve climbed (and descended) about 15 meters for every 1 km ridden (or 79 feet per mile), or an average gradient of +/- 3%.
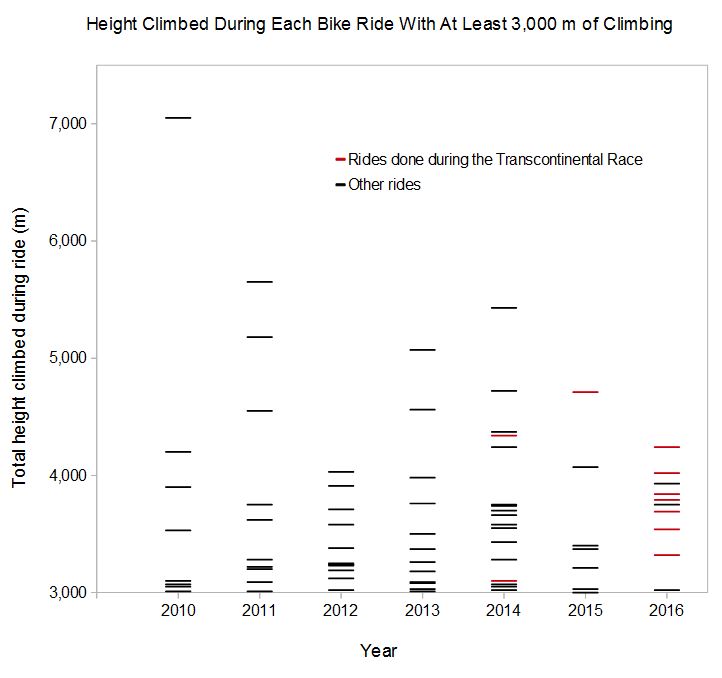
The next graph shows each ride in which I climbed more than 3,000 meters. I’ve done 17 rides with more than 4,000 meters of climbing in the past 7 years, with the most being 7,050 meters during the 2010 AlpenBrevet cyclosportive which goes over 5 massive mountain passes in central Switzerland. The far larger amount of climbing in the 2016 edition of the TCR compared to 2014 and 2015 is apparent by the increase in the number of red lines for 2016.
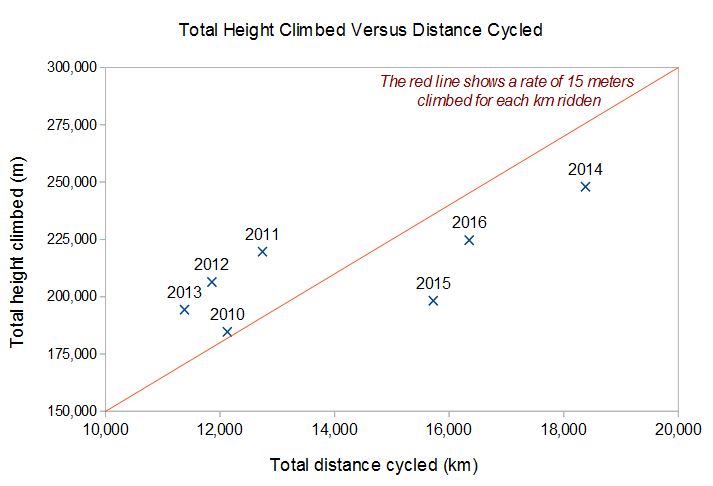
The next graph shows the total climbing I’ve done each year and compares this to the total distance ridden. Each year is plotted as a point based on the total distance ridden on the x-axis (these are the same total values that are shown in the very first bar chart above) and the total height gained on the y-axis.
The diagonal red line in the graph shows the values that would be expected if the rate of climbing was always 15 meters per km. The data from 2014-2016 all fall below this line, with an average rate of climbing of 13.3 meters per km and the 2010-13 data all fall above this line, with an average rate of climbing of 16.7 meters per km. This difference of around 25% is partly explained by the fact that my rides in the previous 3 years have generally been flatter and longer, but is also partly due to the different bike computers that I’ve used across the years each calculating height gain slightly differently.
It’s actually quite difficult to compare height gain data collected using different devices. The first problem is that there are three ways to compute height gain: using a barometer in the device to measure air pressure changes (which tends to be the most accurate except when the sensor gets block by rain water, etc.), using the GPS signal to triangulate vertical position (which tends to be the least accurate), or elevation data can be corrected using a location database when a GPS track is uploaded to a website (this is reasonably accurate, but the level of detail varies widely between different regions of the world). Even between devices that use the same method of measurement, different devices can use different criteria to decide what constitutes a real climb and what is random noise in the signal. In addition, different websites can arrive at different height gain values for the same route when doing route planning and when asking them to correct the elevation data in a recorded ride.
I’ve collected height gain data using 4 different devices in the past 7 years. In 2010, I used a simple bike computer without GPS that had a barometer, but was very sensitive to weather conditions so I often had to manually correct erroneous values. Between 2011 and 2013, I used a Garmin Edge 500 and 800, which both seemed to measure similarly to each other. Since 2014, I’ve been using a Garmin Edge 1000, which I found showed about 10% less height gain for the same route as the Edge 500 and 800. Garmin appears to have updated the algorithms used in more recent firmware updates, and there appears to now be less discrepancy between models. However, height gain should be treated as a very rough measure that contains a lot of systematic as well as random errors.
Exploring
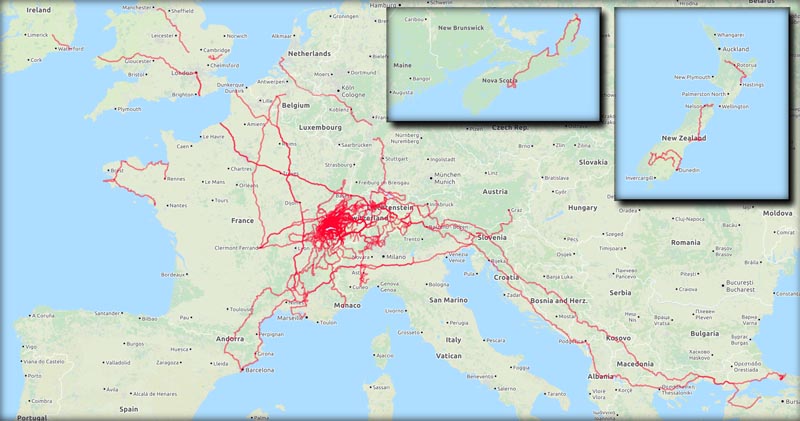
Having looked at measures of distance and climbing, I now turn to my primary motivation for Riding Far – exploring new regions. The map below shows everywhere that I’ve ridden since 2011 (when I got a GPS-based bike computer). It doesn’t show any cycling that I did before 2011, which would include long tours in the UK, France, Germany, Spain, the Netherlands, Canada, and the USA. Click on the map to see a larger version.
As explained in a blog post that I wrote last month, I was excited to discover the Explorer scores that are computed by the VeloViewer website that quantify how explorative you are when cycling. I’m now up to third place out of all the people who have put their data on that site according to their measure of the number of map tiles that I’ve cycled through, with my GPS data covering almost 23,000 tiles (each of which covers a region that measures about 1.7 km by 1.7 km).
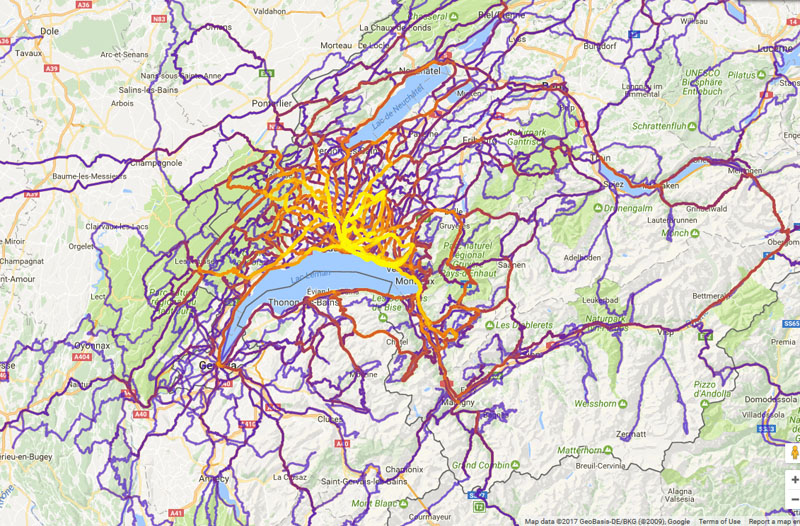
Here is a slightly different version with a heat-map that highlights the local routes that I use most frequently in bright yellow whilst those that I’ve ridden only once are in light blue. It was generated by Jonathon O’Keeffe’s site.
Prior to 2010
I’ve been using a bike as my main means of transport and spent my free time exploring the world by bike for about 20 years. I’ve only logged my ride data for the last 7 years, which is when I’ve done most of my biggest rides; I estimate that prior to that I had ridden about 60,000 km in total. This makes my complete distance cycled until now about 160,000 km (100,000 miles), or four times around the Earth. Before 2010, I had probably done about 10 rides that were longer than 200 km (with my first being when touring through New England and Maritime Canada in 2003) and about 5 rides with more than 4,000 meters of climbing (with my first being in the Swiss Alps in 2007 or 2008).
VeloViewer
If you want to peform similar analyses on your own data, then I highly recommend signing up for the Pro version of VeloViewer. I upload my rides to Strava to share them with everyone (see my profile) but I then use VeloViewer to give me far more interesting achievement statistics, analysis tools, and data organization aids. VeloViewer gives lots of options for presenting your data and a nice summary for each year of riding (e.g., see my VeloViewer summary for 2016), but I made the above graphs myself (except for the maps), but I couldn’t have done most of this without the statistics that I obtained using VeloViewer.
This page is in the My Annual Cycling Summaries section. The next page in this section is:

