As I explain on the Time Management & Measuring Time Efficiency in Bikepacking Races page, how you divide your time between riding, sleeping and doing other tasks is at least as important as your cycling speed in bikepacking races when the clock never stops. Time management should be a major focus of Multi-Day Training Rides for Bikepacking Races because time management skills and efficiency can be improved with practice.
After a ride, you should analyze what time management strategies worked, didn’t work, and try to understand how certain decisions affected other aspects. I recently took another look at my ride data from the 2016 Transcontinental Race to understand exactly how I spent my time during the race and where I could improve. I had kept some notes about sleeping times and the data from my Garmin computer contained the rest of the information I needed (with the aid of the analysis tools at VeloViewer.com to identify when and for how long my breaks were during each day’s ride).
The figure below (click to enlarge it) shows what I was doing during every 15 minutes of my 308 hour-long race: riding = green, sleeping = purple and other activities = orange. Each overnight stop is outlined in light blue and the times of sunrise and sunset are marked in red, with twilight (when the sun is less than 6 degrees below the horizon) in black.
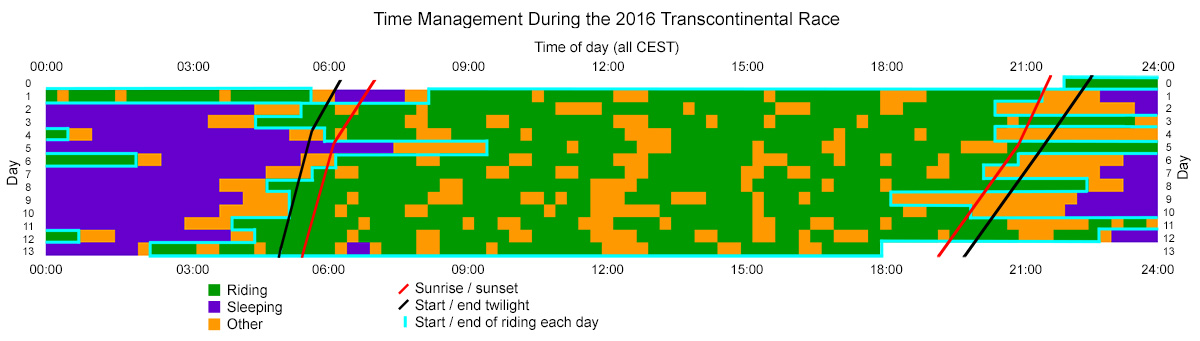
Because I was generally heading southeast during summer in the northern hemisphere, sunrise and sunset became slightly earlier each day and the total length of daylight decreased (data from timeanddate.com). I changed timezones for the final 36 hours, but I have ignored that in the graph.
You can see how I chose to manage the odd start time of 10:00pm by taking a short sleep after a long night ride. On three other occasions, I chose to keep riding until after midnight for various different reasons that I discuss in my race report. My average overnight stop was 7 hours long, during which I slept for an average of 4.5 hours (range = 2.5 to 7.5 hours). During the final morning, I took a short nap. I stayed in hotels on 6 nights and slept in a bivvy bag in quiet, rural, hidden locations the other 7 nights.
Between when I started in the morning and when I stopped for the night, a period which lasted 17 hours on average, I was moving an average of 78% of the time (13.25 hours). I always took a 30-60 minute break around lunchtime and there were normally a couple of other 30-minutes breaks during the day.
The above graph is useful to visualize how the time that each day’s ride started and stopped affected the timing of the next day, but it doesn’t show what proportion of time was spent riding, sleeping and doing other things each day so well. The following graph therefore presents this information in a simpler, clearer format (again, click to enlarge it).
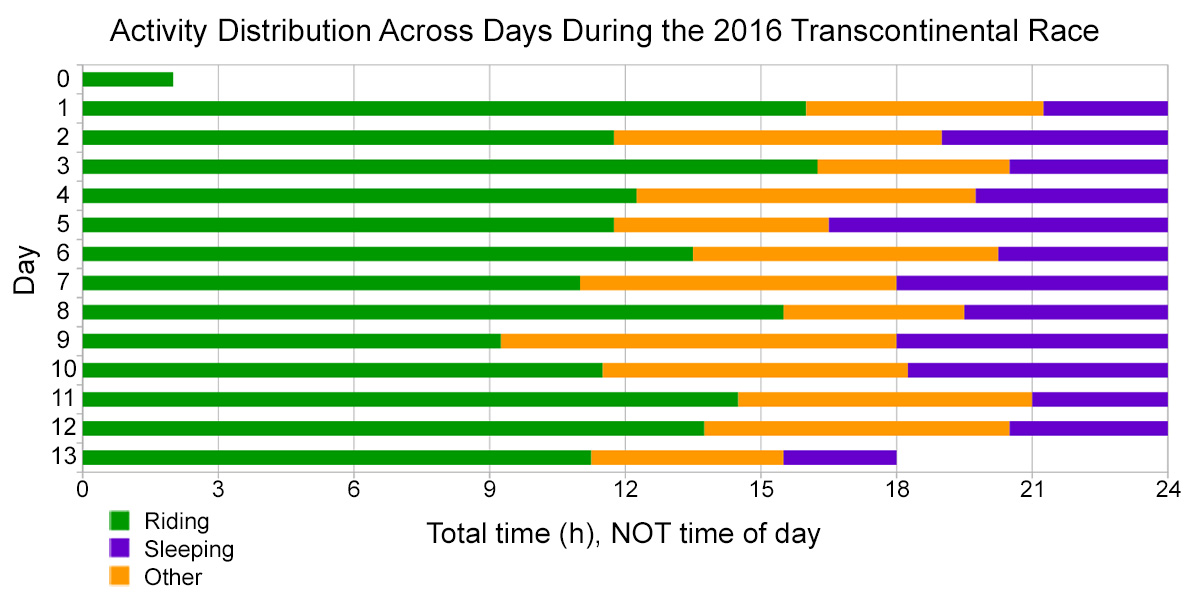
I remember each of these days vividly, so it’s useful for me to see where the numbers correspond to how I felt I was progressing and my level of time efficiency, where my subjective experience differed from the objective data, and where are the most obvious opportunities to be more efficient.
Instead of going into a detailed analysis of my data, I simply want to encourage people to assess these kinds of statistics for some of their rides so that they can learn about the importance of time efficiency, the percentage of time spent moving and whether the time management decisions that they made were optimal or could have been improved. Improving my time management and efficiency is certainly one of the main reasons why my relative performance improved greatly between my first and third Transcontinental Races. Fortunately, you don’t need to spend as much time as I did processing your ride data and creating graphs because some simple reflection on these aspects can already be very useful.
Ride Statistics & Map
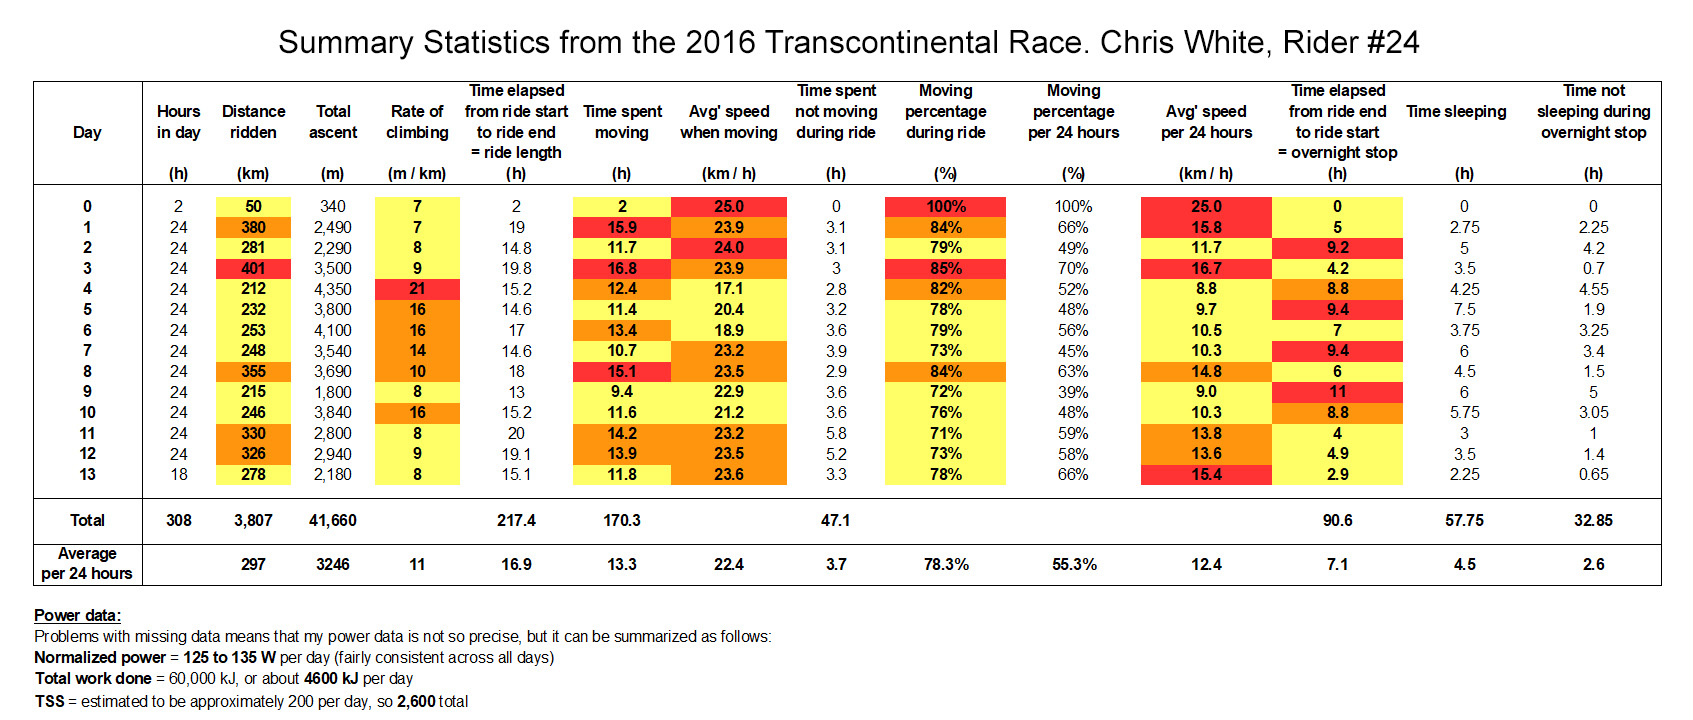
If you really like ride data then the table below contains all of the vital statistics from my 2016 TCR ride (again, click to enlarge it). The most important values not already mentioned above were that I rode a total of 3,807 km with 41,700 meters of climbing in 12 days and 20 hours. This makes an average of 297 km per 24 hours (range = 212 to 401 km) with 3,250 meters of climbing, so an average rate of climbing of 11 meters climbed per km. My average speed was 22.4 km/h (13.9 m/h) while moving and 12.4 km/h when including all stops.
I’ve highlighted what I believe are the most important statistics and have color-coded the days with the highest values for each of these measures. Hopefully this allows people to see that there is a lot more to measuring how successful a day of riding was than simply stating the distance ridden; distance by itself gives very little information.
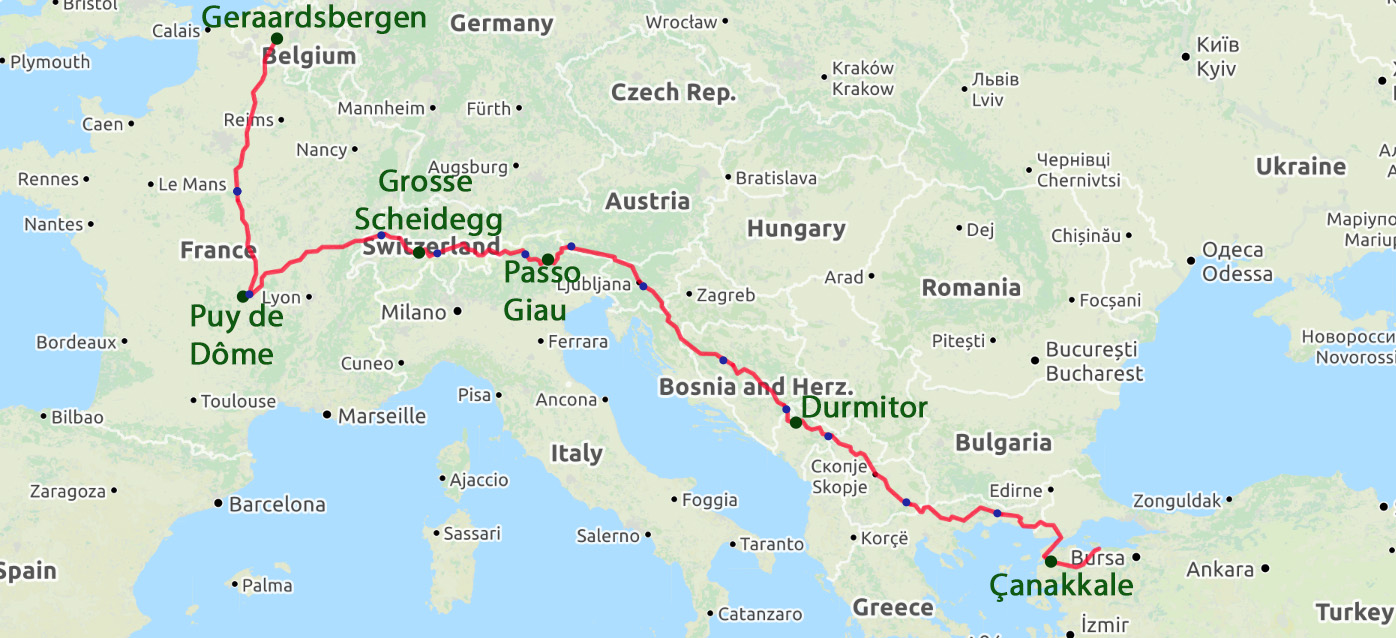
Finally, here is a map of my route with the start, finish, and intermediate checkpoints marked in green and overnight stops marked in blue.
Lessons to Learn from the Numbers
I wasted a minimal amount of time during the day. I would have liked my moving percentage to have been above 80% during the day; I only achieved 78% but that was partly caused by my repeated tire and tube problems that I couldn’t control (again, see my race report). The only way that I could significantly improve my moving percentage during the day would be to do more eating while riding instead of stopping to eat my main meals, but at the same time those stops were necessary for my body to have some occasional rest.
Averaging only 4.5 hours of sleep per night was not a problem for me, even though I normally average about 7 hours per night at home. Getting up in the mornings sometimes took a lot of will-power, but the only time that I felt tired while riding was on the final morning, so I then stopped for a short nap.
On the evenings when I stopped at a hotel, I did waste some time looking at social media and doing other non-essential tasks. Although this was not essential for making progress in the race, that time was important for me psychologically because I was taking time out to mentally relax and occasionally spend a bit of time not being in a hurry to do everything. It may therefore be unwise to completely minimize this aspect while still being able to enjoy and absorb the whole experience, but if I wanted to race more seriously then I could gain some time there.
I pride myself on making navigational errors extremely rarely, and that was again the case during this race. However, my route was not optimized purely for speed and was more of a balance between taking more interesting routes and enjoyable roads while still trying to make progress reasonably efficiently. Again, if I wanted to race more seriously then some improvements could be made to the efficiency of my routing.
I rate cycling speed as being less important in determining progress than is the amount of time spent off of the bike and how good the planned route is and your ability to follow it. Even so, cycling power and therefore speed is still important. Given my level of fitness entering the race, I don’t feel that I could have got much more out of myself in terms of pedaling power and I generally did a good job of staying well fueled, so I have no regrets there. However, if I wanted to race seriously then I would need to adopt a more rigorous approach to my training and do specific training rides and exercises to increase my capacity to maintain a higher level of power without causing any stress on my body; some off the bike work would also be helpful.
The final way to improve my performance might be to use different equipment. I certainly carry a bit more luggage than most other people in these races, but that is partly because I prefer to be prepared and not have to worry about unanticipated problems. In addition, I know from the results presented in the What Determines Cycling Speed? section of this website that even a change in luggage weight of a couple of kilograms would not change my cycling speed by anywhere near as much as most people assume. I focus a lot more on the aerodynamics of my clothing than most other racers, which more than compensates for the marginal amount of extra weight that I carry, so I don’t wish to make any significant changes in my equipment choices (I mostly got that figured out during my first two races).
Results
As well as being extremely satisfied with my personal performance, I was also pleased with my performance relative to the other participants in the 2016 TCR. I came across the finish line in 31st place out of the 216 starters, which is in in the top 15%, so I was well inside my goal of being in the top 20% overall. 138 people (64%) finished the race.
My progress during the race was also satisfying because I started at a steady pace, reaching checkpoint 1 in 83rd place, but then moved up to 47th, 41st, and 33rd at checkpoints 2, 3, and 4, respectively, before crossing the line in 31st. I had no particularly fast sections between any two checkpoints but apparently many other riders were slowing down during the race whilst I was able to better maintain my pace. Once penalties were added and people put into certain classifications, I was 25th out of the 84 solo, classified finishers. For analyses of the progress of all participants during the race, see the page dedicated to the Transcontinental Race No. 4, 2016.