In 2014, I rode far more than ever before. As well as riding my bike, I also love generating statistics, graphs, and maps, so this is a breakdown and summary of all of my rides during the year. Note that clicking on an image will enlarge it.
My total distance ridden was 18,366 km (11,412 miles). This includes 3600 km during the Transcontinental Race (TCR) and 1600 km of commuting/doing errands around Lausanne (I choose to not have a car). Looking at the averages for smaller time periods, I rode an average of 50 km per day, 354 km per week, and 1530 km per month!
Two other ways to look at the amount that I rode this year are that I was on the bike for a total of 792 hours (an average of 15 hours per week) and that I climbed (and descended) 215,000 metres, which is sort of the equivalent of climbing from sea level to the top of Mt Everest about every 2 weeks.
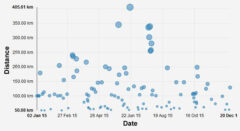
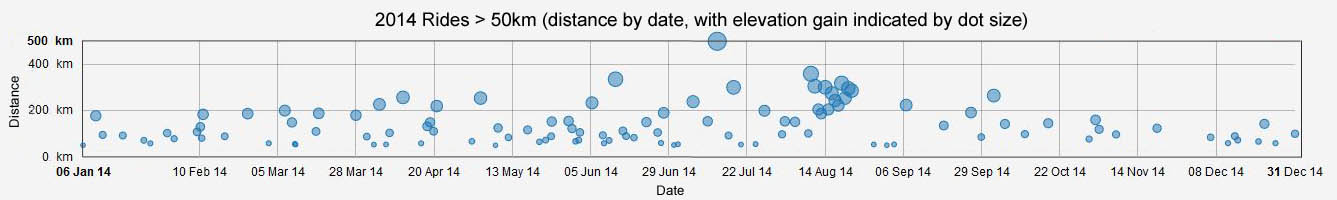
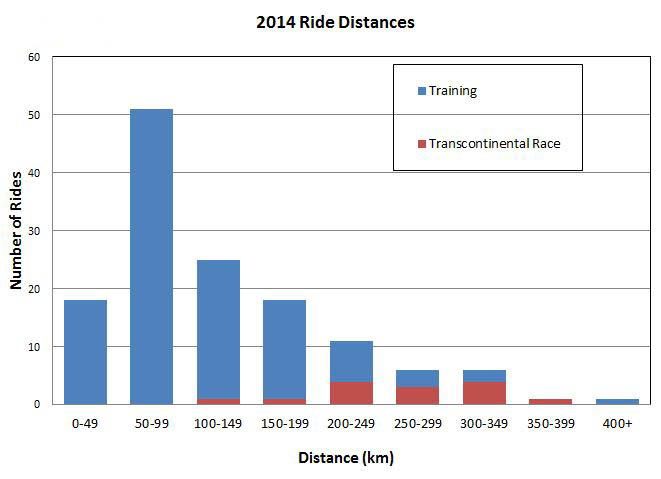
My longest ride was 500 km from Paris to Basel in early July, which I completed in about 27 hours of elapsed time, 21 of which were on the bike. I also did 24 rides of more than 200 km, 12 of which were during the TCR. I actually did more rides of more than 200 km than of less than 50 km, of which there were just 18 (not including commuting). The length of each ride is shown in the top graph on the left, and the frequency distribution of ride lengths is in the second graph.

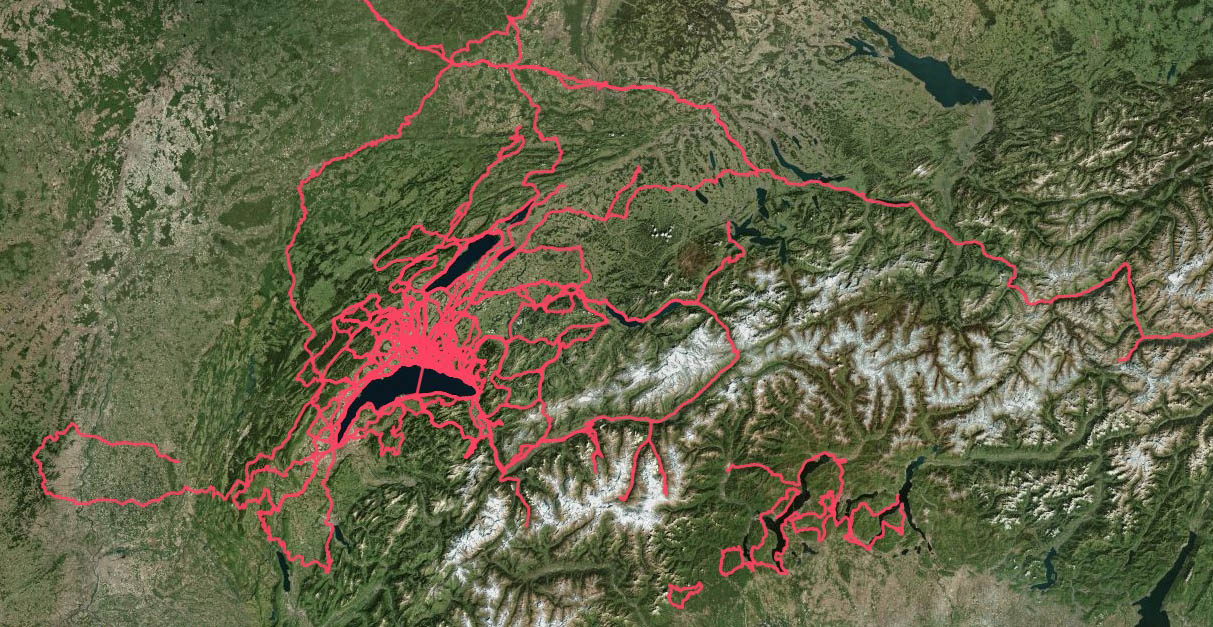
There is also a map showing all of my rides this year around Switzerland and the surrounding countries. Finally, I’ve included my favorite image made by a ride route – a dinosaur head, which was completely unintentional!
If you want to see any more details about specific rides then see my Strava profile, or my VeloViewer profile. VeloViewer is the site that I used to make most of these images and I highly recommend using it if you want a more powerful tool to analyze and visualize ride data; everything is imported from Strava so it is simple to do.
This page is in the My Annual Cycling Summaries section. The next page in this section is: