I started bike touring over 20 years ago and have always marked the major routes that I’ve ridden on maps . At the start of 2010, I started logging my cycling more rigorously and by 2011 I had a Garmin computer and was using Strava. I’ve therefore logged almost all of the kms that I’ve ridden during the decade of the 2010s, so here’s an extended look at that data. I did this mostly for my own amusement, but maybe others will find it interesting. Click on an image to see the full-size version.
Totals and yearly/monthly variation
During the past decade, on average I’ve ridden about 39 km per day or 14,300 km per year. This has included about 1,500 meters of climbing per 100 km ridden, which is a relatively high rate because I live in Switzerland and enjoy riding in the mountains.
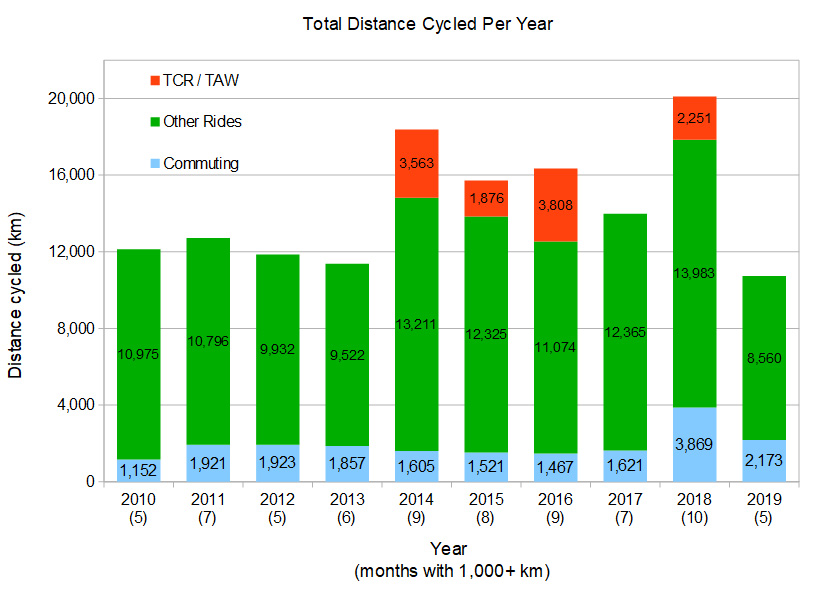
I haven’t owned a car during this time and so nearly always use a bike or train for transport, so about 13% of my total distance ridden was commuting, shopping, etc. I generally don’t record commuting as individual rides, I just enter a rough estimate at the end of each week as a private activity on Strava. The rest of my riding was for pleasure/sport, but some of that does include an element of transport, for instance when I do long rides that end with a visit to more distant friends.
There’s been reasonable variation in the amount of riding I’ve done between different years. 2018 was my biggest year ever, having finally broken through the 20,000 barrier (with over 300,000 meters of climbing). Reaching the goal was helped by having a further commute to work than in other years, but staying on schedule took a lot of focus and motivation during the second half of the year, which is part of the reason why my distance was more subdued in 2019.
2019 was actually my lowest yearly total since I started logging my riding. We moved into a new apartment and I spent a lot of time working on that, but I also had to recover from several recurrences of my sciatica problems (pinched nerve in my back). That’s all settled down now, so I hope to be riding a lot more again in 2020.
It’s also apparent that when I started doing ultra-distance, self-supported races in 2014, my yearly distance increased significantly and I’ve marked the riding that I’ve done during these races separately: three Transcontinental Races (TCRs), including scratching in 2015 (again due to sciatica), and one Transatlantic Way (TAW).
I’m really lucky that I’ve had no serious crashes and the only health issue that’s affected my riding significantly is the sciatica, which has never completely stopped me from riding. I’ve therefore not had any lengthy periods off of the bike.
From November through February I tend to ride about 700 km per month, but come March the longer rides start to kick in and my average for the warmer 8 months (with more daylight hours) is over 1,400 km per month. The peak being in August is largely due to most of my TCR days being in that month; in non-race years my peak was typically in June or July.
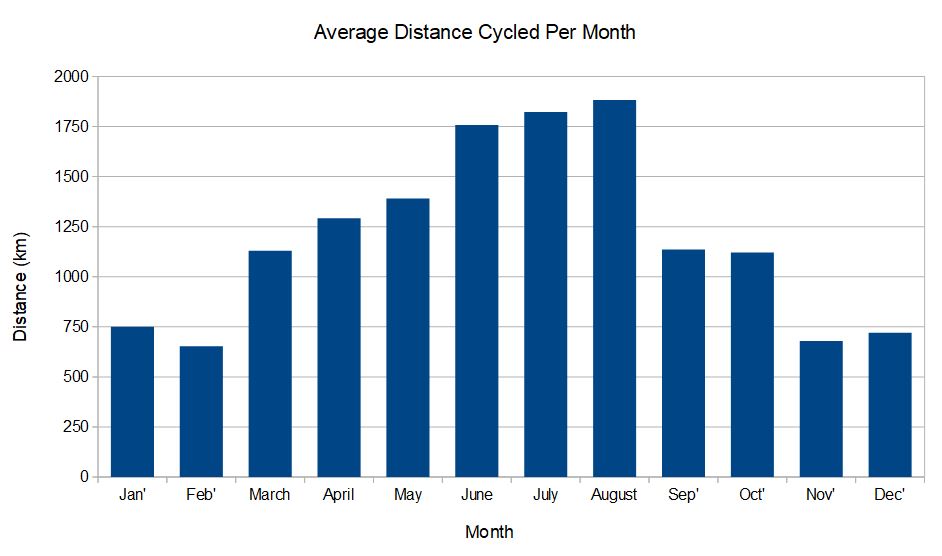
Some people try to ride more than 1,000 km in every month of a calendar year, but I’ve never achieved that in more than 10 months out of 12 (with 9 consecutive months being my record). On 9 occasions I’ve ridden more than 2,000 km in a month, 4 of which included a race.
Individual rides
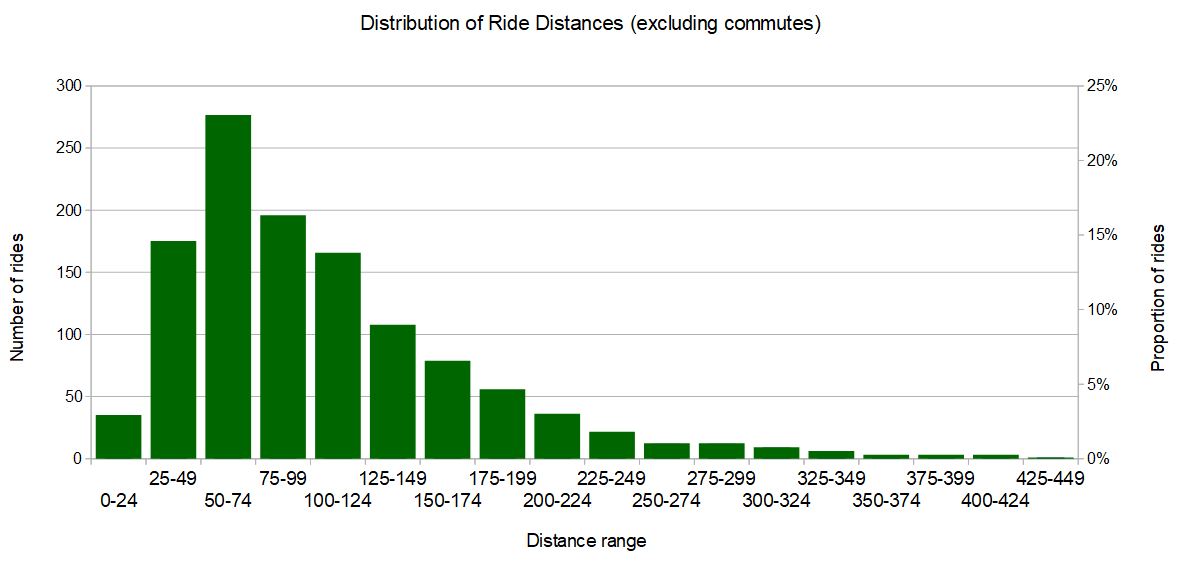
Looking at the distances of my individual rides (excluding commuting), the most pleasing result is that over 20% of my rides have been at least 150 km long. In contrast, only 17% of my rides have been shorter than 50 km.
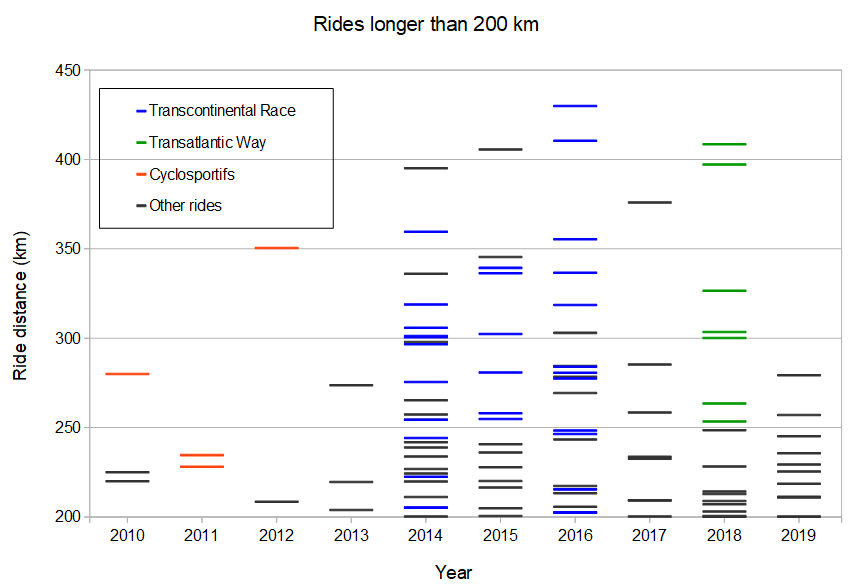
I’ve done 106 rides of more than 200 km, which are shown in the next graph, organized by year and with certain ride types marked. 2011 was the only year when I didn’t do a ride of at least 275 km and my longest single-day ride ever is 430 km, which I did during the 2016 TCR. Riding 500 km in under 24 hours remains one of my unachieved goals.
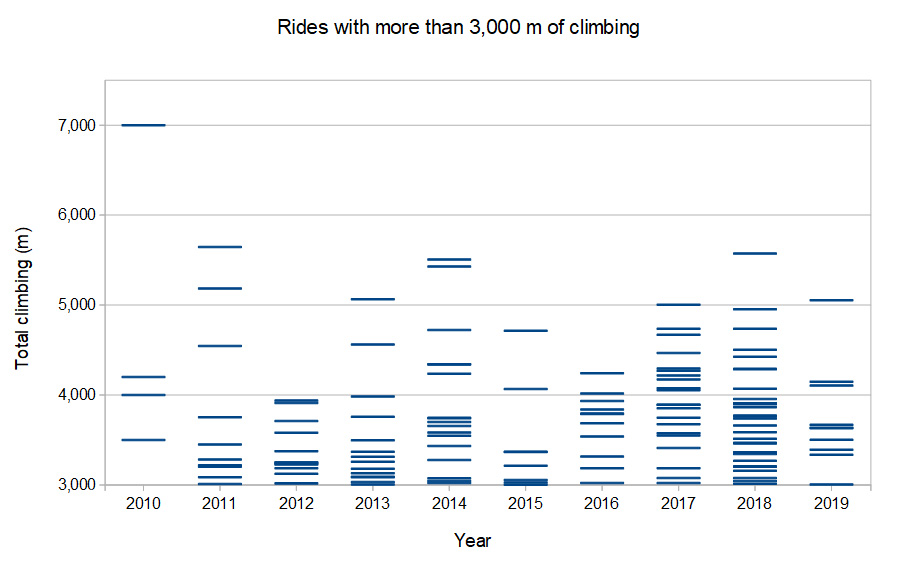
The next chart is similar, but shows the 139 rides in which I climbed at least 3,000 meters of elevation. This makes it clear that although I wasn’t doing as many long rides before 2014, I was already doing plenty of rides that encompassed a serious amount of climbing. In fact, my biggest climbing day ever was in 2010 when I did a ride with 7,000 meters of climbing: the AlpenBrevet cyclosportif around the Alpine passes of central Switzerland.
The Eddington number is a useful measure of how much Riding Far someone has done (see VeloViewer for a detailed explanation of it). When using kms my Eddington number is 171, meaning that I’ve ridden 171 km at least 171 times (my equivalent for miles is 119).
A long-term goal of mine is to have an Eddington number of 200 in kms, but for that I need to do another 94 rides of 200+ kms; at my current rate that’s going to take 6-7 more years. I may pass 200 rides with at least 3,000 meters of elevation gain sooner than that – the remaining 61 such rides should take 3-4 more years at my current rate.
Exploring the World
Seeing new regions and places is what really motivates me to Ride Far and this heat-map shows the areas that I’ve covered during the past decade (generated using Jonathan O’Keeffe’s website). The northern side of Lake Geneva is obviously my home region, but I’ve spread my glowing blob at least 50 km in each direction from there.
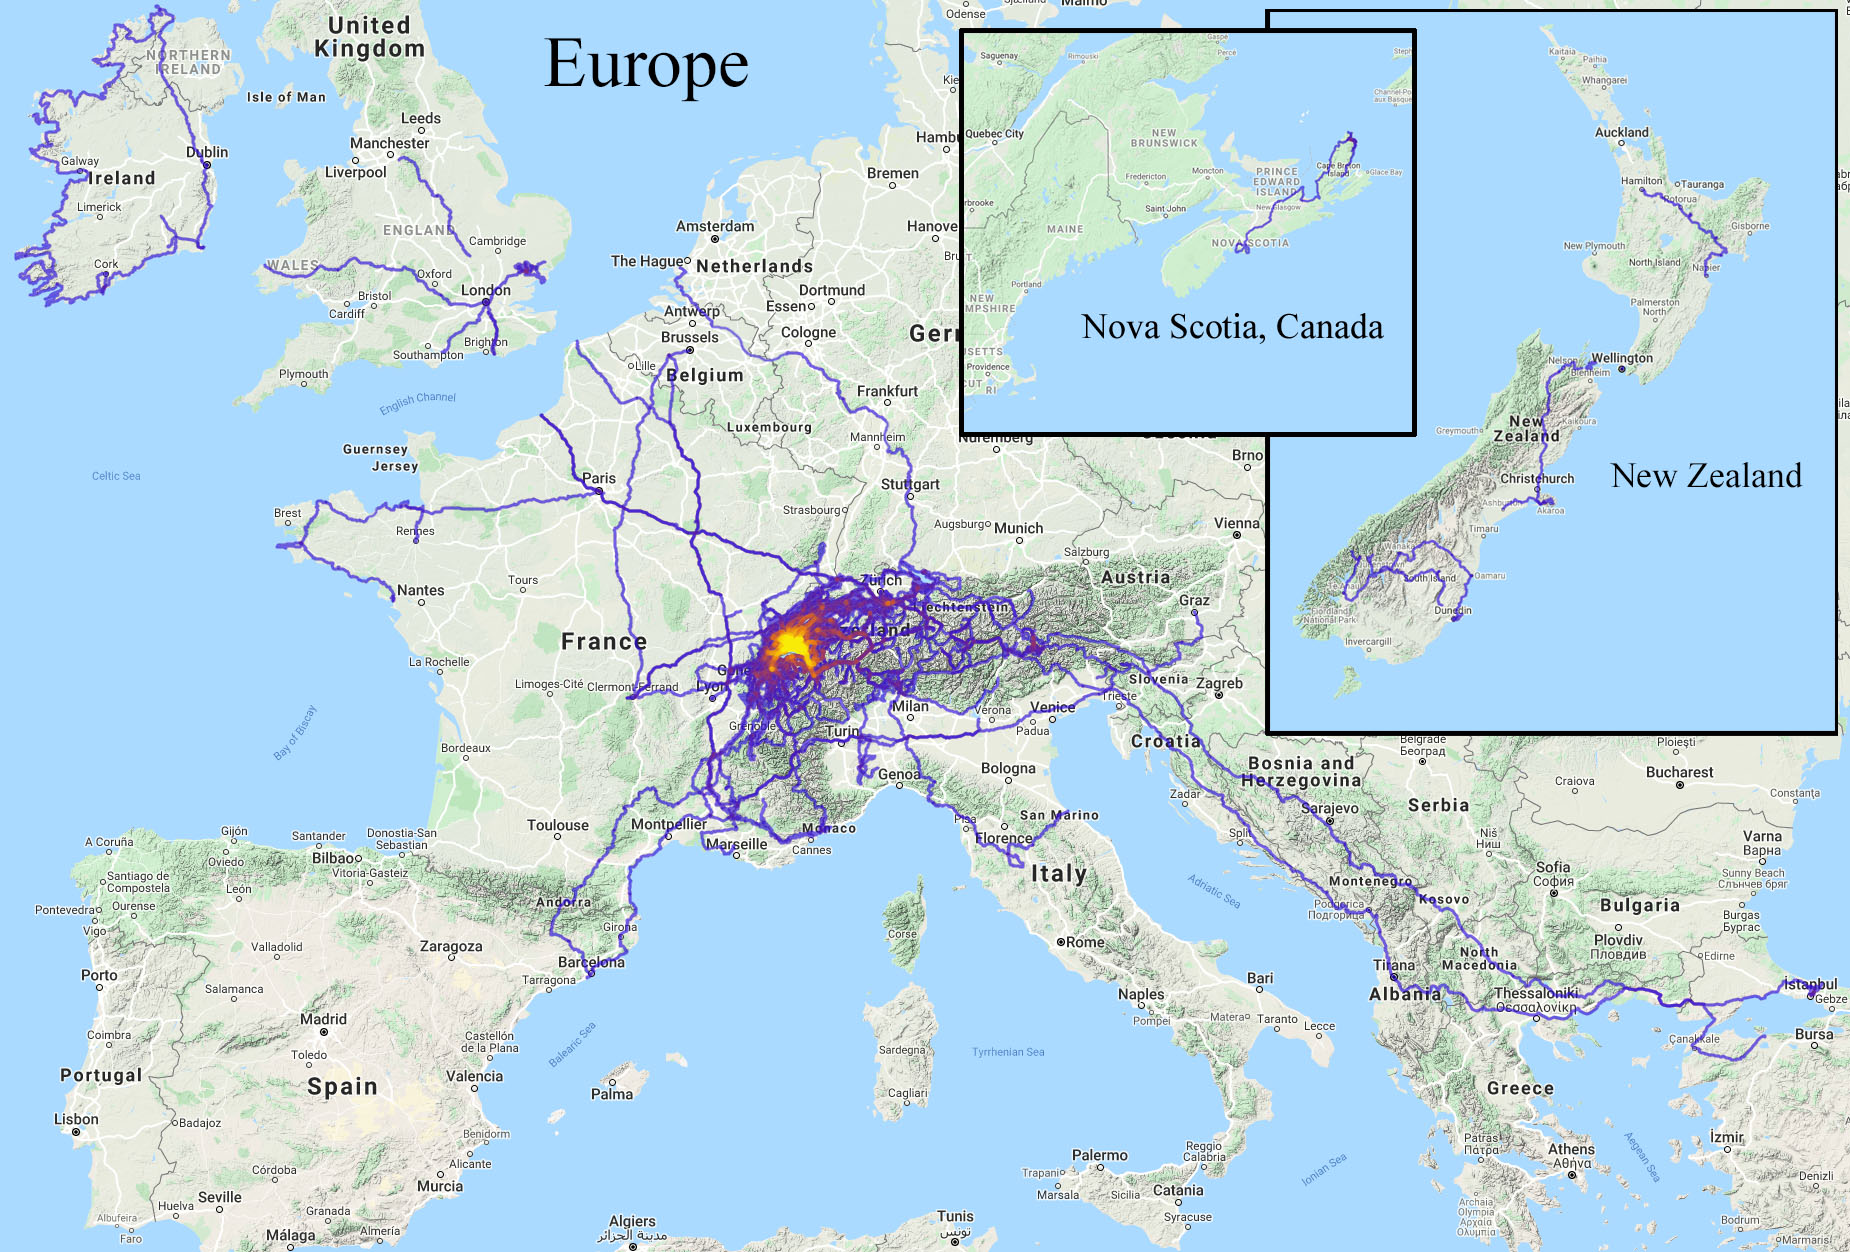
The two TCR races in which I made it all the way to Turkey are quite apparent in SE Europe, as is the TAW along Ireland’s Atlantic coast. This year I plan to do another TCR, which will include more riding in southern Germany, eastern Austria and also out to Romania and Bulgaria for the first time.
Many of the other trips that I’ve done have been in various regions of the Alps, with the Dolomites having a slight purple glow. I’ve done other long tours throughout western Europe, sometimes alone but often with my wife.
Despite growing up in the UK, I’ve done very little riding there, which is something that I hope to address this summer, possibly doing an indirect version of the classic Lands End – John O’Groats route while I’m over there for the Hard As Nails Everesting Challenge. I’m also considering doing the Two Volcano Sprint bikepacking race in 2020 that will take me to the tip of Italy’s boot and beyond.
I’ve included a couple of sections of map outside of Europe, with similar scales as the European map. My wife is from Nova Scotia, Canada, so I’ve ridden there while visiting her family. Way back in 2012 we took our tandem to New Zealand for a fantastic bike touring and camping trip that was one of my favorite ever.
In late 2016 I discovered a measure of how many regions I’d visited, called the VeloViewer Explorer score. I’ve discussed this in previous blog posts (e.g., this one from late 2018); the principle is that it counts how many map ’tiles’ that you’ve ridden through, with the tiles based on an arbitrary division of the map into 1.7 x 1.7 km square segments. This map shows the tiles that I’ve visited in red or purple:
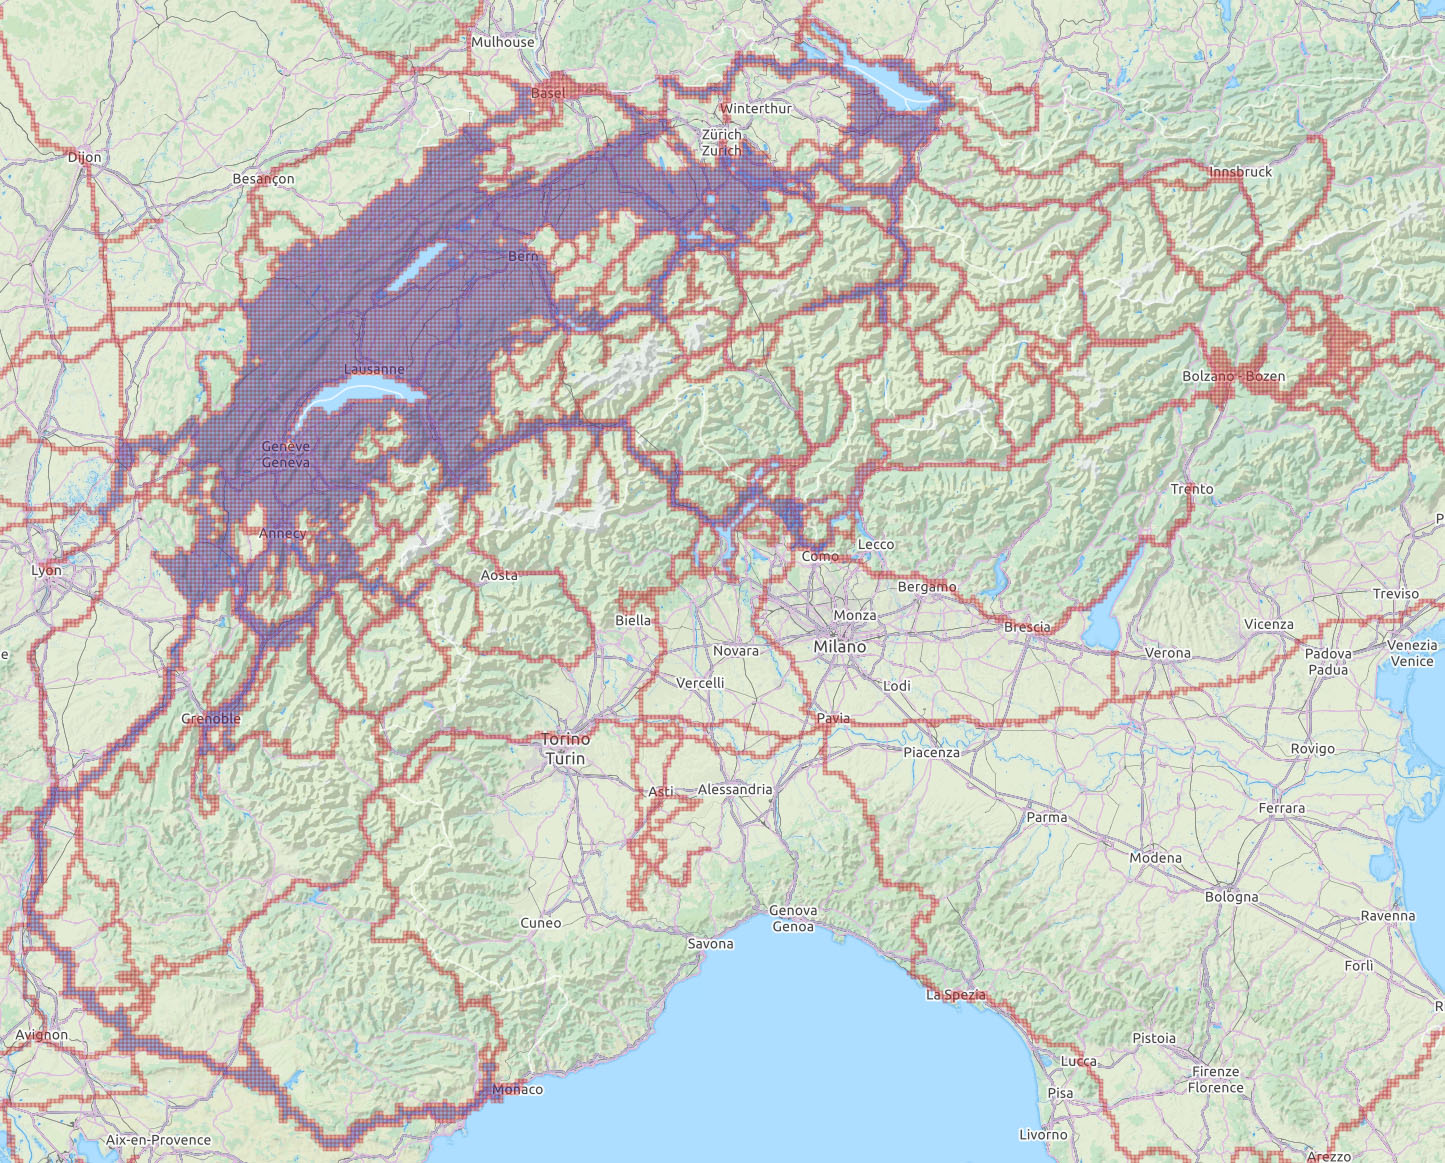
I’ve visited every tile within over 80 km of my home and have also tried to extend my purple “cluster” (an unbroken area of tiles in which every tile to the north, east, south and west has also been visited) into some distant regions, including through France to Monaco, up to Lake Constance, Germany and over the Alps and down to Lake Como, Italy.
I have a few future goals with the Explorer score. One is to extend my cluster east to the regions I’ve ridden in the Italian Dolomites. Another is to finish riding every tile in the Swiss part of the Jura mountains, and possibly also complete the French Jura. I find the more bike-accessible terrain of the Jura mountains to be more interesting riding than the much higher Alps, where it’s often hard to find a decent way between steep-sided valleys.
Resources
Strava is very useful for sharing rides, but not very good for collating and analyzing ride data. For the latter, I highly recommend importing all of your Strava data into VeloViewer, which is straightforward to do and that site then does a lot of the hard work for you. It’s also easy to export your entire ride history from VeloViewer into a text file and then a spreadsheet so that you can manually compute further metrics and create your own graphs like those above.
Thanks for reading, it’s now time to go out and start racking up some kms in the 2020s …

This is the final page in the My Annual Cycling Summaries section, which is in My Personal Ride Reports.