How to minimize mechanical resistance of a bike’s drivetrain and hubs is discussed because it can account for 4-8% of the total resistance experienced by long-distance cyclists.
Page Contents:
- Method, Finish Times & Effects of Increasing Power on Cycling Speed
- Types of Resistance When Cycling
- Bike Gear Shifting Systems & Derailleurs
- Bike Wheels
Method
Although component manufacturers have long understood what does and doesn’t make a difference in drivetrain resistance, this information has rarely been made available publicly. Fortunately, Friction Facts have done independent testing and published their results. Information in the reports sold by them was used to enter rough efficiency estimates into the model of cycling speed. For anyone interested in this topic, I highly recommend reading the Friction Facts reports. See the General Method page for more information on how the simulations were run.
Results
Chain
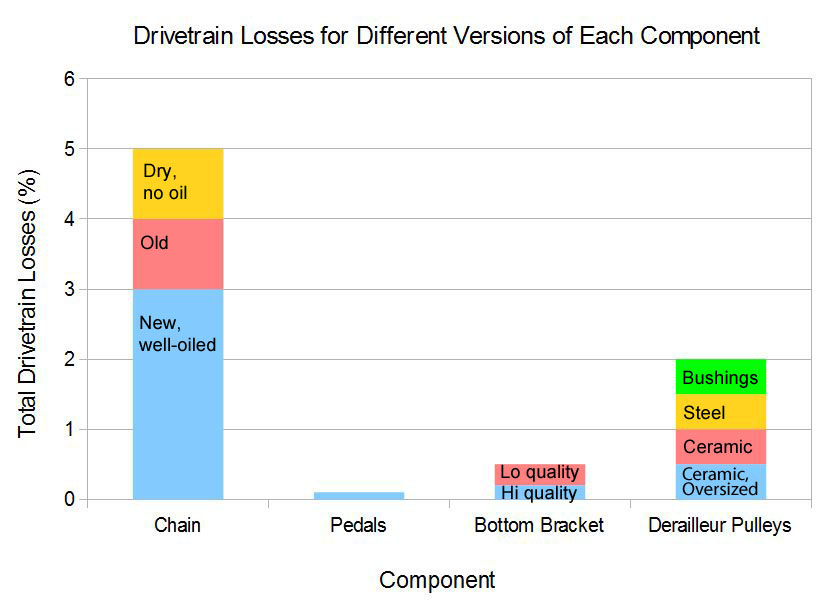
The main source of resistance in the drivetrain is the chain. Even a new, well-oiled chain will lose about 3% of the power that is put into the pedals. This is in the typical bikepacker range of 150-200 watts; efficiency is slightly better at higher levels of power. If the chain is dry, for instance after riding through a rainstorm that has washed away the oil, then this could cause a further 1% of power to be lost. If the chain is so old that it has become elongated then another 1% of the power could be lost.
The standard case used in the simulations in this section assumes that a reasonably new, well-oiled chain is used throughout the race. The worst-case scenario is having an old chain that has no grease left on it. This 2% decrease in drivetrain efficiency will decrease average speeds by about 0.25 km/h (1.2%) and may result in 2 hours extra cycling time for the 3900 km 2016 Transcontinental Race (TCR) route (or a predicted finishing time that is about 4 hours later).
Differences in efficiency between different models of chains are quite minimal, although Shimano Dura Ace chains tend to come out best in the tests. There are measurable differences between different chain oils, with up to 0.5% better efficiency for certain types (or half an hour of cycling time), see the Friction Facts reports for details.
Derailleur Pulleys
The other main source of drivetrain resistance is the pulleys in the rear derailleur. If the pulleys are good quality with steel bearings then about 1.5% of the power is lost. Many derailleurs come with pulleys that don’t have bearings, but instead have simple bushings; each pulley that has a bushing instead of a bearing will sap about 0.25% of the power that is put into the pedals. Pulleys with ceramic bearings are also available, and using two of those can reduce the losses in the rear derailleur to just 1%. See the figure above for a summary of the different possibilities.
The standard case used in the simulations assumes that both pulleys have steel bearings, so causing 1.5% of power to be lost. If both pulleys had bushings then the average speed would be reduced by about 0.06 km/h, and the total cycling time would be increased by about 30 minutes. In contrast, if both bushings had ceramic bearings then the average speed would be increased by about 0.06 km/h, and the total cycling time would be reduced by about 30 minutes.
There is evidence that using oversized pulleys (13-15 teeth instead of 11) could make the rear derailleur more efficient. The cost of a set of oversized pulleys with the required longer rear derailleur cage starts at about €250, but may reduce the total losses from the rear derailleur to just 0.5%. This would cause the predicted speed to be 0.12 km/h faster than with two standard-sized steel bearing pulleys, or a saving of 1 hour of cycling time (or half an hour compared to standard-sized pulleys with ceramic bearings).
Pedals & Bottom Bracket
The other bearings involved in the drivetrain are the pedals and the bottom bracket. As long the pedals have no play and the bearings are in good condition then they shouldn’t lose any more than about 0.1% of the power that is put into them. There is some variance in bottom brackets, with basic, stock models sapping about 0.5% of the power whereas high quality models can be as low as 0.2%. A higher quality model doesn’t necessarily need to have ceramic bearings – there are many models with high-quality steel bearings that are as efficient as much more expensive models that have ceramic bearings. Using a high-quality bottom bracket may increase the average speed by 0.03 km/h, or a saving of about 15-20 minutes of cycling time over the 2016 TCR route.
Hub Bearings
Regular hubs only cause about half a watt of resistance each at average riding speeds, but this can be halved by using high-quality ceramic bearings. Even so, the effect on speed is very small, with average speed increasing by no more than 0.05 km/h, or a saving of about 20 minutes of cycling time over the 3900 km TCR 2016 route for changing the bearings in both hubs to ceramic. If using a dynamo hub, the bearings in the front hub cannot be changed, meaning that the possible gains should be halved. The high cost of such an upgrade is therefore difficult to justify, see this article at road.cc which includes comments from a couple of wheel manufacturers who refuse to offer a ceramic bearing option because of the extreme cost:performance ratio. For a technical explanation of the differences in bearing types, see this Slowtwitch article.
Dynamo Hubs
The default setup used for the simulations reported in this section is a bike equipped with a dynamo hub that is in use 25% of the time to power lights and charge devices because this is a reasonably typical bikepacking setup. A good-quality dynamo hub consumes about 1 watt of power at typical speeds (20-30 km/h) when not in use, which is about 0.5 watts more than a standard hub, and the dynamo hub consumes about 6 watts of power when in use. Such values have been reported in independent tests for SON and Shutter Precision hubs, with the best Shimano hubs drawing about 0.5 to 1 watt more (e.g., see this test published by the CTC). In addition, a good dynamo hub weighs about 250 grams more than a standard front hub. So, how much of an effect does such a hub have on cycling speeds?
When not in use, the extra resistance given by a dynamo hub compared to a standard hub will decrease average speeds by only about 0.05 km/h due to the resistance and by about 0.02 km/h due to the extra weight, for a total penalty of 0.07 km/h. An average-strength rider will therefore increase their cycling time to complete the 2016 TCR route by about half an hour due to having a dynamo hub that is never used instead of a standard hub (a difference in predicted finishing time of about 1 hour).
What about when the lights connected to the hub are turned on, or something is plugged in to charge? The electrical power does not come for free, and so average speeds are reduced by about 0.3 km/h (or 1.4%) when power is being drawn compared to when it is not. If the hub is in use 25% of the time when riding (i.e., 3 hours per day while cycling) then the overall average speed will decrease by a further 0.07 km/h (0.3 * .25), or a total of about 30 minutes extra cycling time across the entire route when compared to someone who never uses their dynamo hub (or 1 hour compared to someone who doesn’t have a dynamo hub). If the lights or devices are left permanently turned on / connected then overall speed will decrease by 0.3 km/h, meaning that the cycling time will be increased by 2.5 hours compared to someone who never uses their dynamo hub (or a predicted finishing time that is 5 hours later).
Discussion
Several useful pieces of advice can be extracted from these results:
- Always start an ultra-distance race with a reasonably new chain and oil it whenever it starts to get dry. Plastic eye-drop bottles can be used as mini oil containers.
- Check that rear derailleur pulleys spin on bearings and not bushings. Energy savings are not massive, but the cost to replace the pulleys is quite small and doing so is more effective than many other far more expensive upgrades (the effect on overall speed can be similar to that achieved by saving about 1 kg of weight).
- Energy lost from bearings (pedals, bottom bracket, and hubs) is quite small, so the savings that can be achieved by changing any of these bearings to ceramic bearings is probably not worth the extra cost (see also this road.cc article).
- Having a good-quality dynamo front hub loses a minimal amount of energy when it is not in use. Average predicted speeds are reduced by about 0.3 km/h when power is being drawn from the dynamo, which is worthwhile for powering lights to remove all concerns about whether there is enough charge remaining in the batteries.
- Using a dynamo hub to charge all devices (GPS, phone, etc.), thereby making the dynamo draw power a lot of the time, will cost significant time. Battery-powered USB cargers can recharge small electronic devices multiple times, are cheap, and are not heavy (see the USB Chargers page), so I recommend using those instead of using dynamo power for device charging.
It should be noted that many models of cycling speeds use a default value of 3% for total drivetrain losses. The standard model used in the simulations reported in this section used the data published by Friction Facts that suggests that at the level of power output of an average-strength bikepacker, a more accurate value is about 5% (including chain, derailleur pulleys, bottom bracket, and pedals). Of course, these losses are only realized when pedaling, which is why the pie charts in the Types of Resistance page show that only 4% of the total resistance experienced across the entire route is due to drivetrain losses.
Last significant page update: November, 2016
This page is in the What Determines Cycling Speed? section. The next page in this section is: