Garmin GPS bike computers offer almost all of the information that you could ever need while cycling and much more than most people want. However, there is still some information that the unit is collecting but cannot be displayed with the standard data field options.
Using 3rd-party Garmin Connect IQ apps and data fields greatly expands what Garmin devices can display, but if you still can’t find the information that you need then there is an app that you can use to make fully-custom data fields called AppBuilder. I explain how to do this using the example of keeping track of how efficient I’m being with stops and breaks during an ultra-distance bike race.
Note: This article was written in mid-2021 and the instructions should still work with Garmin Edge 530, 830 and 1030 units, plus some older ones. It’s now early 2023 and the latest Edge 1040 models are a bit different and the ConnectIQ app that is needed, AppBuilder, is not currently available for the 1040 and I don’t know of any alternatives. Please let me know in the comments if you find a way to do this on the 1040 devices. Thanks.
Measuring time efficiency
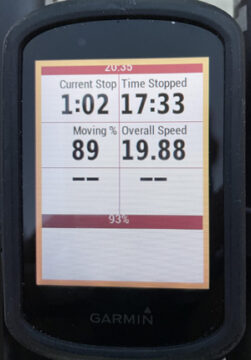
In ultra-distance, self-supported bike races like The Transcontinental Race (TCR), average speed when riding is a reasonable metric for gauging your rate of progress, but overall speed including all stops is even more important because the race clock never stops. You can change the settings on your bike computer to show average speed either including or ignoring stops, but there is normally no option to display both of these useful measures. I show you how to do this below.
To minimize the time spent during each stop, it’s useful to track how long the current stop has lasted. I’ve seen some of the faster racers manually start a stopwatch every time they stop, but it would be better to have this happen automatically. This can also be done using AppBuilder.
Another important metric that I like to use is the percentage of total time spent moving compared to the total elapsed time, which I call ‘Moving %’. It’s often far easier to improve stopped time and moving % than it is to increase your average riding speed, and by doing so your rate of progress can be greatly improved without using any extra energy. The first step to improving something is to measure it, so read on to find out how to do so.
Time efficiency in these races has only occasionally received the attention that it deserves. It was touched on in this blog post by Apidura, there is a page here on Ride Far dedicated to the topic: Time Management & Measuring Time Efficiency in Bikepacking Races, and I wrote a blog post analyzing my time usage during the 2016 TCR: The importance of time efficiency and time management in bikepacking races.
How to install AppBuilder on Garmin devices
Making custom data fields on a Garmin device involves installing the AppBuilder Connect IQ app and entering the formulas for the new data fields. This involves a lot of steps but none of them are complicated and most people should be able to do it without problems.
My examples involve measuring the amount of time stopped during an activity and overall rate of progress, but AppBuilder is very powerful and can be used to display almost any metric imaginable. See the examples on this page to get an idea of what is possible. I also use it for several other custom data fields that I don’t describe here because they are too complex or idiosyncratic.
These instructions are for a Garmin Edge bike computer and were written in early 2021. Similar procedures should work on many Garmin watches and other devices. I can’t troubleshoot every problem that might occur, but I’ll try to update these instructions if I’m aware that something significant has changed.
- Using a Windows PC or Mac, launch Garmin Express from your programs menu (or install it here).
- Connect your Garmin device to your computer and wait for the Garmin’s screen to show the connected symbol.
- In Garmin Express, select the device from the list or if it hasn’t been connected before select ‘Add a Device’ and then ‘Add Device’ when it appears. You’ll probably need to login to your Garmin account at some point.
- Once the screen for the device is shown, select ‘Connect IQ Apps’ or ‘IQ Apps’. If this is not an option, then you probably have a more basic or older Garmin device that doesn’t support Connect IQ Apps.
- In the bottom-right corner of the window, click on ‘Get More Apps’, which will take you to the Connect IQ website in your internet browser and again you may need to login to your Garmin account.
- In the search bar at the top of the browser window, type ‘AppBuilder’.
- The current generation is AppBuilder 5, of which there should be a few different versions displayed, click on the first ‘AppBuilder 5+’ icon (as shown in the image on the right), then click on ‘Download’, ‘Allow’, ‘Accept Terms’, click the checkbox and ‘Open Link’ (some of these instructions may differ based on your browser or OS).
- Return to the Garmin Express program, the upper status bar should show that your device is in the process of syncing, so wait for it to say ‘Sync complete!’.
- Select ‘Connect IQ Apps’ or ‘IQ Apps’ again.
- The list of apps should now include AppBuilder 5+. Click on the grey box with three dots inside ‘…’ that’s next to the AppBuilder 5+ name to access the app’s settings.
- At the top of the window that pops up, you can change the app’s Theme Color, with the default being Dark Red, but you might want to change it to match the color of the Activity Profile you use on your Garmin.
- By scrolling down the window, you’ll see Fields 1 to 6 where you can enter your custom formulas, the results of which will be displayed on your new data page.
- You can use whatever ‘Labels’ you want, but keep the names short and clear because they will be displayed on the Garmin screen. I’ve given suggestions below.
- Six formulas are shown below that track metrics about time spent stopped during an activity. Copy and paste them into the ‘Formula’ fields. If writing them manually, it is not case sensitive and the spaces are optional (note: someone commented below that they only work in lowercase, but I haven’t experienced that being important).
- For each field, you need to select which format to display the results in, so I’ve included this info in the details below. You also have the option to ‘Record data to FIT file’, leave that as ‘Off’.
- When you’ve finished entering everything, click ‘Save’.
- You can now close the Garmin Express window and eject the Garmin device from your computer (the method depends on your computer and this may not be necessary) and then unplug it.
- Everything else is done on the Garmin device, so turn it on and wait for the home screen to display.
You now need to add the custom data screen to the activity profile you use when cycling. The menu screens and labels differ slightly between different Garmin devices, but the following instructions are typical for modern Garmin Edge devices.
- Select ‘Settings’ (often a menu icon with 3 horizontal bars).
- Select ‘Activity Profiles’ and choose the appropriate profile.
- Select ‘Data Screens’.
- Select ‘Add New’.
- Select ‘Data Screen’.
- Scroll down to the bottom and select ‘Connect IQ’.
- Select ‘AppBuilder 5+’ by clicking on the square to the right of the name to display a check-mark/tick.
- Select ‘Back’ (a curved arrow in the bottom-left of the screen).
- Save the changes by clicking on the check-mark/tick in the bottom-right of the screen.
- Approve the changes by clicking on the check-mark/tick in the bottom-right of the screen.
- You’ll then return to the Data Screens page, where you can re-organize the order of the pages by using the icons; click on the check-mark/tick in the bottom-right of the screen when you’ve finished organizing.
- Keep selecting ‘Back’ (a curved arrow in the bottom-left of the screen) or ‘Exit’ (a cross in the bottom-left of the screen) until you return to the home screen.
- Once a new activity is started, you can scroll through the pages until you find your new page with your custom fields.
For the formulas below that measure time efficiency to work correctly, you need to do two other things:
- Make sure that the Garmin pauses the ride timer when you are stopped. On Gamin Edge devices, this setting is accessed through: Home Screen -> Settings -> Activity Profiles -> [Your profile] -> Auto Pause -> Auto Pause Mode -> ‘When Stopped’ or ‘Custom Speed’. ‘When stopped’ should work well if your Garmin is connected to an ANT+ wheel speed sensor, but if speed is only based on GPS data then set it to ‘Custom Speed’ and I find that 4 km/h (2.5 mph) works well.
- Leave your Garmin running when you are stopped, even if the stop is for a longer period. Do not press the stop button or turn it off – just leave it running and let it pause the timer automatically, only press Stop when you have completely finished the ride. Modern Garmin Edge devices generally have very good battery life so leaving them turned on during stops is normally not a problem. If you do need to turn it off when stopped to save the battery, then it won’t cause a problem, but the metrics might not be accurate afterwards.
Formulas for custom data fields that measure time efficiency
Below are the formulas and details for the 6 most important time efficiency and overall progress measures that I use:
- Label: Current Stop
Formula: elapsedtime – max( elapsedtime )
Display format: Time2
Explanation: Displays the length of the current stop in minutes and seconds. - Label: Time Stopped
Formula: elapsedtime – timer
Display format: Time2
Explanation: Displays the total time spent stopped during the ride in minutes and seconds. - Label: Total Time
Formula: elapsedtime
Display format: Time
Explanation: Displays the total ride time including stops in hours, minutes and seconds. - Label: Moving %
Formula: 100 * timer / elapsedtime
Display format: Number
Explanation: Displays the percentage of time that you have been moving compared to the total time including stops. - Label: Riding Speed
Formula: avgspeed
Display format: Decimal
Explanation: Displays the average speed not including stops. - Label: Overall Speed
Formula: avgspeed * timer / elapsedtime
Display format: Decimal
Explanation: Displays the average speed including stops. For example, if your Riding Speed is 25 km/h and Moving % is 80% then your Overall Speed is 20 km/h.
Some of these fields are not giving entirely independent or necessary information. Feel free to replace them or adapt them to your needs.
Some people have reported that when copying and pasting the formulas for Current Stop and Time Stopped, the minus signs get replaced by another symbol, which then returns an error message, so please check that all symbols are correct when copying.
Adding individual custom data fields
I’ve explained above how to add a complete page of custom data fields using AppBuilder 5+, but it is also possible to add individual custom data fields that can be included on data pages with other standard data fields and formatted as the user desires. Doing this for multiple data fields makes it more complicated to explain completely, so I presented the simpler method above. For those that want individual data fields, I summarize below the differences in the methods.
Step 7: On the Connect IQ website, instead of selecting ‘AppBuilder 5+’ you can select one of the instances of ‘AppBuilder 5’; this gives you a single custom data field instead of the pre-set screen of 6 custom data fields. There are 4 instances of ‘AppBuilder 5’ so that you can have multiple custom data fields; install as many as you need.
Step 10: Each instance of AppBuilder 5 should now appear in the app list in Garmin Express, with any extra ones being labeled B, C, and D. Adjust the settings of each of them separately and keep track of which contains which formula so you know what they are when selecting them on your Garmin later.
Steps 11: The option to change the app’s Theme Color no longer exists. Instead, you have options about using different formulas for each Activity Profile on your Device, but this is an extra complication that is unnecessary here. I leave this set to ‘Auto (by sport)’ and the Quick Profile Select option to ‘Disabled’; I then enter all of my formulas in Profile 2 (Cycling).
Steps 20-32: Most of the steps on the Garmin device are now different. The easiest way to show a new custom data field is to display a current data screen then press and hold one of your current data fields, then click on that field again to change it; scroll down the list of categories to ‘Connect IQ’, then select the version of AppBuilder 5 that contains the appropriate formula. If you want to re-format a data screen to add more data fields or to add a data screen, then start by doing Steps 20-22 and proceed from there, but that’s beyond the scope of this article.
Discussion
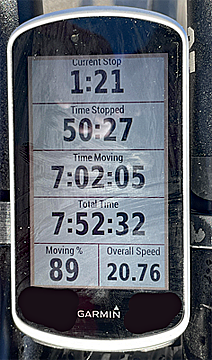
Ever since Connect IQ apps were launched several years ago, I’ve tried a few different ways to get time efficiency information to be displayed on my Garmin. I had varied success with early attempts and none of them worked well or reliably enough to share publicly. I’ve been using the method described above with AppBuilder on a Garmin Edge 1030 for over a year (and briefly tested it on an Edge 830) and it has been very reliable (although I have seen it show some weird values a couple of times). I hope it works well for you, but any glitches are out of my control. As shown in the screenshots above, the display looks quite different on the Edge 830 and Edge 1030, I don’t know why or how to change this.
If you connect Garmin to your phone by Bluetooth, you can install a Garmin Connect IQ app on your phone and customize the Connect IQ apps with that app. I have used this with AppBuilder to test how different versions of more complex formulas perform during a ride, but the formula editor is not as easy to use on the phone, so I prefer to use the computer method described above. However, I expect that it’s possible to do everything that I described using the phone app if you prefer.
I don’t have much experience with non-Garmin bike computers, so I don’t know what the best way to add custom data fields is for them or whether it’s even possible. Maybe people can give suggestions in the comments. Also feel free to comment on what custom data fields you find most useful for long-distance cycling.
outstanding! thanks very much for putting this together. This is a game changer for me. No more calculating in my head – I can relax and let the Garmin do the job for me.!
A quick note for anyone who might be using the AppBuild 5+ method noted above on a Garmin 530.
For some strange reason, the Formula’s that Chris kindly provided above need to be entered in lowercase only. I’m not sure if this is a problem specific to the Garmin 530 or perhaps other models, but if you encounter problems whereby AppBuild 5+ will not accept the formula, try using lower case. For example. instead of “avgSpeed * timer / elapsedTime” try “avgspeed * timer / elapsedtime”. etc.
Once I made this change it worked perfectly for me (or it could just be my Garmin 530 :))
Thanks, Gavin. I haven’t had that issue, but I’ve now removed the capitals from the formulas above, so hopefully it won’t be an issue for anyone else.
You can also do this without having to have the Auto-Pause function enabled with some of the other available functions.
Example :
Total stopped time can be calculated as
sum(speed_raw lt 0.89408).
Display in Time HH:MM:SS
This calculates the total time spent moving at less than 2 mph. speed_raw is the raw data on speed measured in metre/sec. lt is the Less Than comparator. Like wise you can get moving time by replacing lt with gt, Greater Than.
sum(speed_raw gt 0.89408).
Thanks Dave, that method looks really useful and contains some functions that I wasn’t aware of.
I find that life is simpler when using the metric system and doing so reduces the likelihood of errors. You can convert km/h to m/s by dividing by speed in km/h by 3.6. I usually use 4 km/h as my threshold for not riding, which would mean I would replace Dave’s 0.894 values with 1.111 m/s.