This page contains overall results for the 2013-2019 Transcontinental Races. See the Overview page for a general introduction to the Transcontinental Race (TCR) or the individual race edition pages for more detailed results. See also the official TCR page.
Page Contents:
Finishers
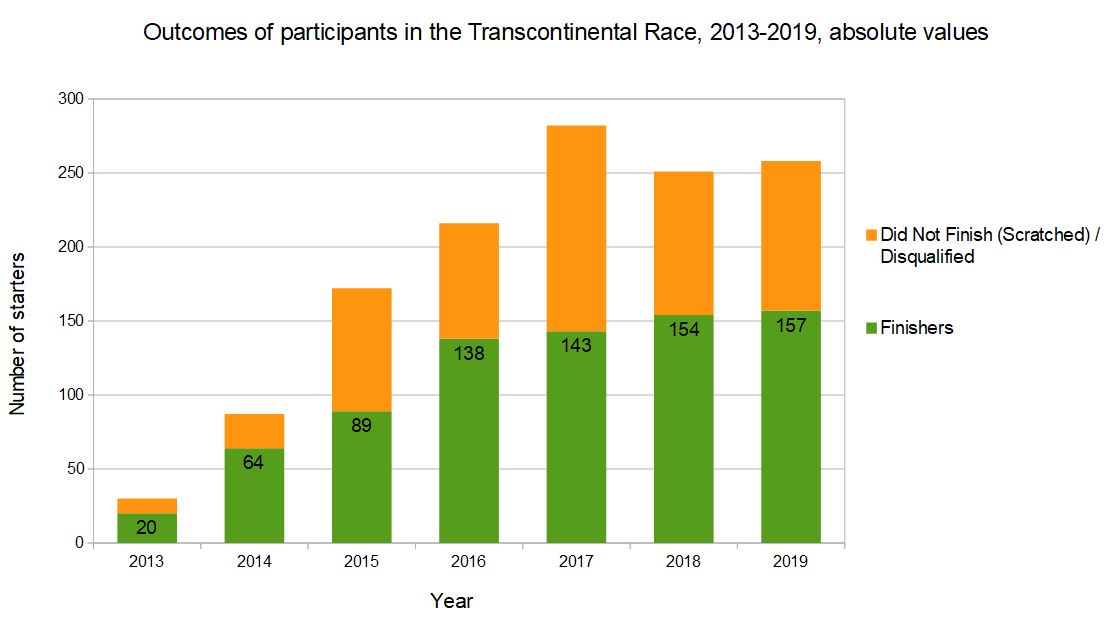
This graph shows how many people finished (green) the Transcontinental Race or scratched / did not finish (orange) in each of the first 7 editions of the race. The number of finishers has increased every year between TCR no1 and no7, despite the number of starting places available only growing during the first 5 years. Since the 2nd edition, the race has always been heavily oversubscribed, but the organizers have experimented with allocating different numbers of starting places to optimize the riders’ experience and manage the event logistics.
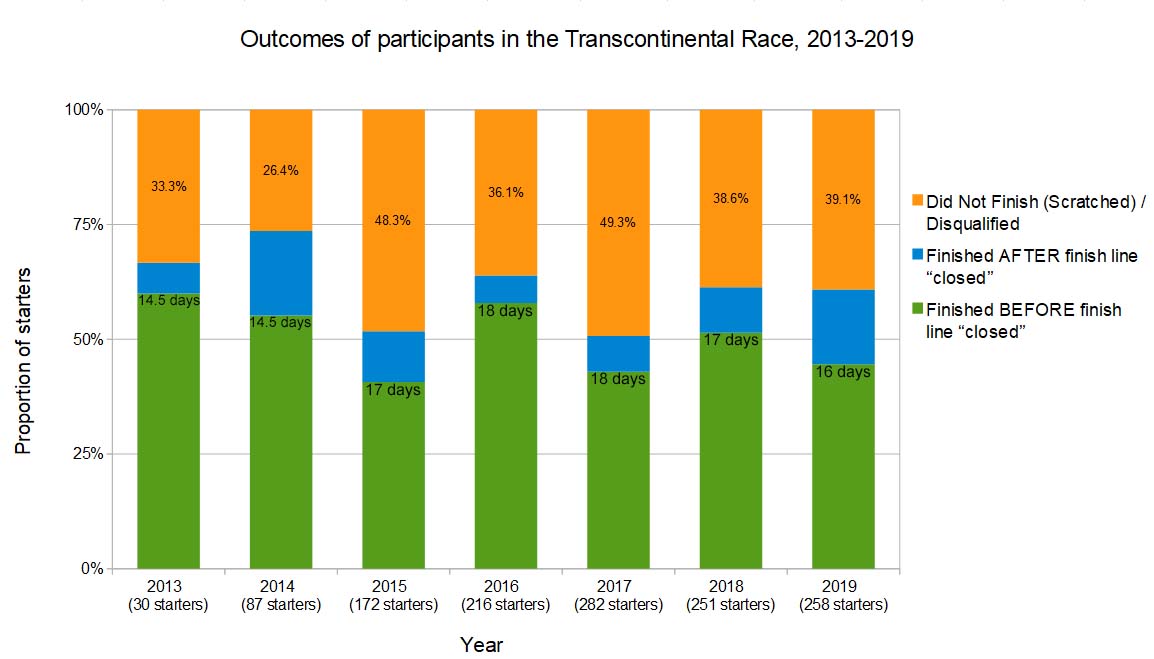
This graph shows the values as proportions, with the finishers divided into those who finished before (green) and after (blue) the finish officially closed (with the deadline also shown). Only 50 to 75% of all starters finish the event, with an average of about 60%. This is not surprising given the length and difficulty of the race and how many things can go wrong.
Finish Times
How long it took people to complete each edition of the TCR is shown in the next graph. The captions on the right should help to explain this “box and whisker plot”; percentile means the proportion of people above that value (lower is obviously better), which is an appropriate measure for a skewed / asymmetric distribution like this.
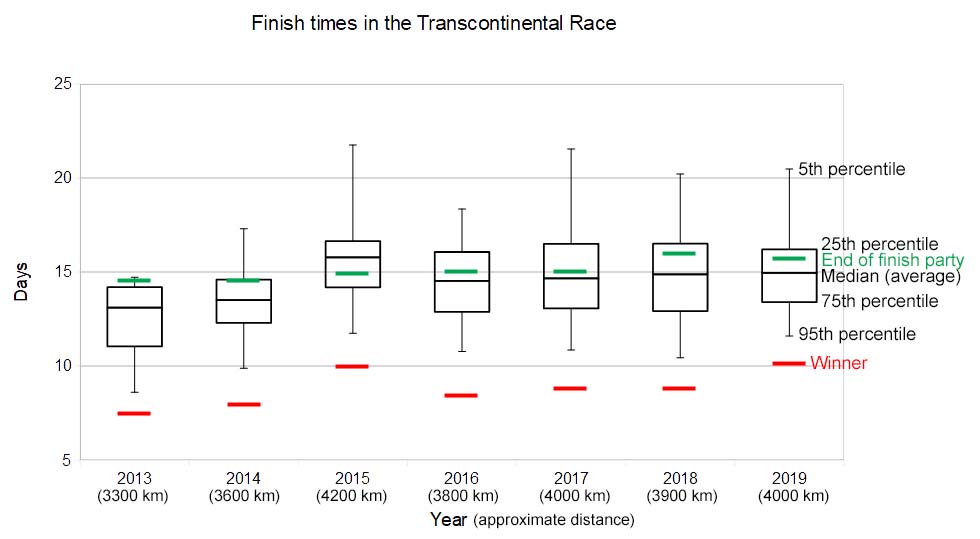
Many people’s goal is to reach the finish in time for the party, which has been between 14.5 and 16 days after the start (which was sometimes, but not always the same as the time that the finish officially closed). Only 483 of the 1,296 starters have achieved this goal (37%)!
Distance Cycled per Day
Finish times are obviously affected by route distance, with the first 2 editions being the shortest and the 3rd edition one of the longest. To compare performance in different editions, the finish times were combined with a rough estimate for the distance ridden in each edition of the race (approximate distances are listed under each year) to obtain the estimated distance cycled per day. The format of the following graph is similar to that for the finish times above, except that in this graph higher values are strived for instead of lower values.
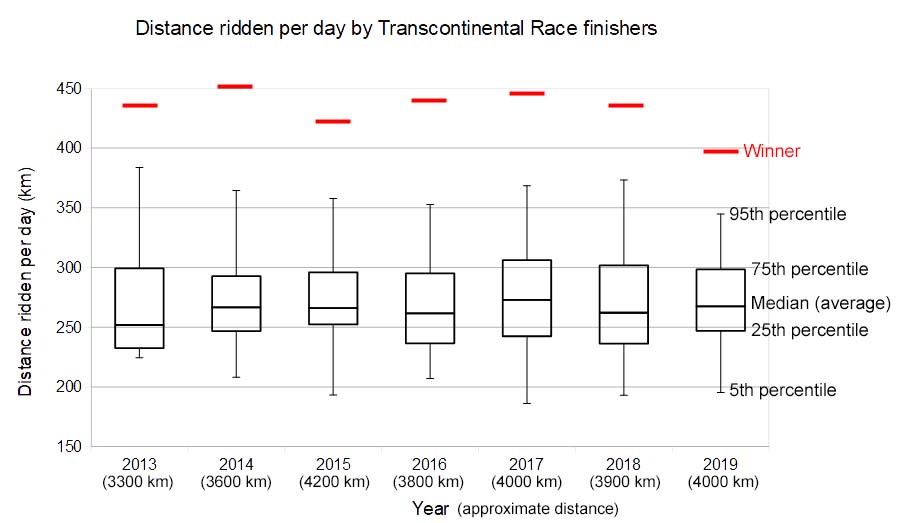
The average (median) distance ridden per day across all finishers in all editions is 267 km. 2017 saw the highest median distance ridden per day of 273 km and the climbing-heavy 2016 saw the lowest at 262 km (ignoring 2013 for which the data is very sparse and the route much shorter).
Median distance cycled per day is one of the better measures for comparing the difficulty of different race editions, but it is affected by other factors including the timing of the finish party (i.e., the schedule set by the organizers). The fastest 25% of finishers haven’t needed to worry about the party deadline, so their performance may be an even better indicator of race difficulty, but even then the difference between races is quite small, with the highest value (306 km per day in 2017) being less than 4% above the lowest (295 km per day in 2016).
Kristof Allegaert holds the record for fastest rate of progress, averaging over 450 km per day in 2014. Fiona Kolbinger’s rate of progress of 395 km per day in 2019 would not have won any previous edition, but it would have been 2nd in all but 2017. However, it’s very difficult to compare across different editions with different routes, terrain, weather and competition – it would have been interesting to see what Fiona could have done if she’d had people to chase the whole way.
Overall, someone who wants to compete for the podium needs to average 375-450 km per day. To be in the top 25% of finishers around 300 km per day is needed. Between 240 and 300 km per day is what the majority of people average. Someone who averages around 200 km per day not only won’t make the party, but also won’t see very many other people on the road after the first few days.
This data only includes finishers in the solo category, not pairs. Distance ridden per day for those who scratch tends to be even more widely dispersed, with people at both ends of the scale ending up in that category, including some people who were on pace to finish in the top 5% before scratching but also many who were doing fewer kms per day than the average finishers.
Notable Riders
In total, there have been 1,296 starters of the TCR between 2013 and 2019, but far fewer different individuals than this because many people have started more than once, so I estimate around 1,000 different individuals.
Kristof Allegaert (Belgium) has won the most race editions, all 3 of the races that he started (2013, ’14 & ’16). James Hayden (UK) has started 4 races and won 2 (2017 & ’18) and Björn Lenhard (Germany) has started 4 races and finished on the podium twice (2017 & ’18). The other winners were Josh Ibbett in 2015 and Fiona Kolbinger in 2019. Richard Dunnett (UK) is the only other two-time podium finisher (2013 & ’14).
Mikko Mäkipää (Finland) holds the record for the most number of starts, having started and finished all 7 editions. Douglas Migden (USA), Stéphane Ouaja (France) and Fabian Rabe (Germany) have all started and finished 5 editions. In 2015, Stéphane was the first person to do the race on a fixed-gear bike; he finished 13th and then did his other attempts on a geared bike and always finished in the top 15. Stuart Birnie (Australia), Matthew Falconer (UK) and Patrick Miette (France) have all started and finished 4 races, with Matthew being on the podium once.
Emily Chappell (UK) is the only woman to start 3 races and was the fastest woman in 2016. Daniel & Guillermo Nicolás Muñoz (Spain) are brothers who have started and finished 3 races as a pair. Neil Phillips (UK) has been on the podium in 2 categories: in 2015 he won the pairs category with Timothy France (UK) and then finished 2nd overall in 2016.
There is no age limit and a couple of people have started the race aged just over 70. At the other extreme, there has sometimes been people starting with the minimum age of 18. People from all regions of the world are encouraged to apply, but the overwhelming majority are European.
(Lack of) Gender Differences
Female participation is encouraged by giving female applicants a far greater chance of being awarded a starting place than male applicants. Even so, only 8.5% of solo starters in the TCR have been female and 14.5% of pairs starters have been female.
Fiona Kolbinger’s win in 2019 helped to prove that the only real gender difference in this form of cycling is the number of starters. Once on the start line, gender appears to have no effect on performance. Other women have recorded overall victories in similar bikepacking events and in several other ultra-endurance sports (e.g., running and swimming), so it is widely considered that women have no overall disadvantage in these sports (for instance, see this article in The Guardian). Women showing that they can compete equally with men attracts a lot of media attention, but is not a surprise to veterans of the sport.
Race outcome is also unaffected by gender because the proportion of women who finish the TCR is very similar to that for men, both around 60%.
Drop-out / Scratch Rate
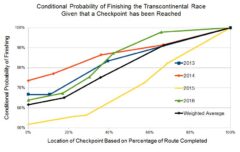
To assess how the likelihood of scratching from the race varies during the event, I divided the data into four quarters and grouped the checkpoints in each race accordingly. I won’t explain the full, complex procedure (interested readers can contact me), but the result is that people appear to be slightly less likely to scratch during the first and third quarters of the race (about 1% of all starters scratch during each 100 km in these periods), more likely to do so during the second quarter (about 2% scratch per 100 km), and nearly all people who make it to around the three-quarters point are able to reach the finish (when about 0.5% scratch per 100km).
Several explanations can be given for this pattern, including when overuse injuries are most likely to become a problem, when motivation is more likely to wane, and when people are most likely to re-assess their schedule and goals. It’s likely to be a combination of these factors plus others and all of these are just untested theories.
Pairs Performance
The pairs category was introduced in 2015 because in 2013 and 2014 various solo entrants rode together while still trying to remain self-supported (which was not explicitly forbidden at the time). Pairs riders can share equipment and draft each other, but are otherwise self-supported. Once the race starts, riders must remain in their declared category (solo or pair) throughout the race to attain a position in the general classification, otherwise they are only eligible to be classified as a finisher.
If pairs were simply a combination of two random solo riders then you’d expect the probability of both members of a pair finishing to be the probability of a solo rider finishing squared, meaning 59.7% * 59.7% = 35.6%. However, 47.3% of pairs have actually finished together (52 out of 110), which is significantly greater than the expected value. It’s difficult to pinpoint what might be the best explanation for this result, and even harder to test it.
Despite pairs finishing together with a higher probability than expected, starting in a pair doesn’t increase an individual’s overall chance of finishing because normally when one member scratches, the other also does. Only 20 people have finished the race after their partner scratched. The overall probability of finishing given that someone started in a pair is therefore 56.4%, which is not significantly different from that of people who start as solos.
Conclusion
The most humbling of all of these results is that despite their best efforts, only about 60% of people who have started the Transcontinental Race have been able to finish. Whether starting in a pair or solo and being male or female doesn’t seem to affect this probability. Finishing in time for the party, which the vast majority of people set as their minimum goal, is even more difficult, with only 37% of starters achieving this.
Certain people appear to have found the key to success; out of the 9 people who have started at least 4 times, a total of 42 starts, only 2 of them have scratched once, meaning that this group has more than a 95% success rate. Scratches do not happen randomly during the race, with the second quarter of the race being when people are more likely to scratch.
The information on this website is designed to help people prepare for self-supported bikepacking races like the TCR, so hopefully they can avoid some of the possible for reasons for having to scratch and maximize their chance of finishing and doing so in a time that exceeds their goals.
Last significant page update: January, 2020

This is the final page in the The Transcontinental Race section, which is in Ride Far, Part III: Bikepacking Races.