Several factors influence a bicycle’s performance and cycling speed in addition to weight: changes in rolling resistance, air resistance of the cyclist and bike, and drivetrain efficiency can all have a larger effect on a cyclist’s speed than a moderate change in the bike’s weight.

Page Contents:
Measuring Progress in Bikepacking Races
The degree of progress or success in self-supported, ultra-distance bikepacking races in which the clock never stops is most easily measured by the distance ridden each day. The same distance can covered by different riders in many different ways, so it is informative to breakdown each day’s performance into three separate measures:
- Average speed when moving – which is the topic of the current section
- Moving percentage while awake – see the Measuring Time Efficiency page
- Length of overnight stop – see the Sleeping Strategies page
Average cycling speed is not only determined by the equipment that is used, but also depends on the rider’s level of Physical Fitness and their degree of Comfort on the Bike, each of which is covered in separate sections of this website. In this section, those aspects are assumed to be equal and the focus is purely on cycling speed.
When trying to increase average cycling speed by choosing optimal equipment, people put an excessive focus on weight. This is mainly due to the other important factors being difficult to measure and information about them not being widely available. In addition, the overall importance of each factor is difficult to understand because the data that is available is reported using a wide range of incomparable metrics (watts of power, watts of drag, efficiency percentage, etc.). Lastly, in many types of bike racing, weight can be reasonably important, but ultra-distance cycling is quite different to most other types of bike races, so the same conclusions do not apply (see The Actual Effect of Weight on Cycling Speed page for further discussion of this point, and there is a good article ar road.cc that reaches a similar conclusion – that weight is vastly over-rated).
Basic Method
The only way to understand the relative importance of each type of resistance on cycling speed and to determine what effect certain changes will have is to incorporate all known factors into one single model of cycling speed. Instead of computing speed in one specific instance/situation (which can be done using several online tools; e.g., The Computational Cyclist), I implemented a model that could be used to investigate how the average speed across an entire route is affected by each aspect of a bicycle’s performance. Bike Calculator (simple and free) and Best Bike Split (complex and requires a paid subscription) are the most similar online tools.
I simulated a typical cyclist in an ultra-distance cycling race, the Transcontinental Race (TCR), by using a power profile that predicts average speeds comparable to those that have been observed for people who finished previous editions of the race in the middle of the rankings. This typical power profile was combined with the route of the 2016 TCR (about 3,900 km and 55,000 meters of climbing according to Strava). Despite the focus on this specific race, the overall findings are useful for understanding what factors determine cycling speeds in general.
Results Summary
Below are the extremely simplified highlights of the results. I strongly encourage interested readers to click on the links on the left to read the more complete reports that describe how the results were obtained and to read many more results that are not included in these simplified summaries.
There is an important distinction between cycling times and finishing times. Data from the satellite trackers that riders carry suggests that typical TCR racers spend about half of the elapsed time actually moving/cycling (i.e., about 12 hours per day). Therefore, any times that are reported as “Possible savings” in cycling times should be doubled to obtain the expected difference in the more important metric of finishing times. However, where appropriate, certain results are already given in terms of finishing times.
| Topic | Findings |
|---|---|
| Race Finishing Times | The finishing time predicted for a typical rider on the 2016 TCR route is 180 hours 30 minutes, and so the rider is predicted to complete the race in about 15 days. The 2016 route is 400 km shorter than the 2015 route but involves far more climbing, so it’s not obvious which route would take riders less time. In fact, the predicted finishing time for the longer 2016 route is about half a day shorter than that predicted for the 2015 route. |
| Effects of Increasing Power | In addition to the average-strength rider, a stronger rider was also simulated who had a 28% higher average power output, which caused the average predicted speed to only increase by 14%, mainly because air resistance has a non-linear effect on speed. If both riders spent the same number of hours per day on the bike, the stronger rider would finish the race almost two days earlier. |
| Types of Resistance When Cycling | 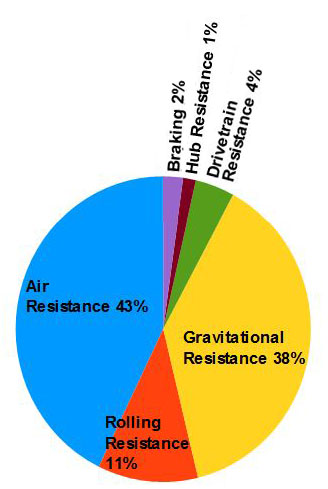 Despite the mountainous 2016 TCR route, air resistance accounts for slightly more of the total resistance experienced by the average-strength rider than gravitational resistance (i.e., weight). The third most important factor is rolling resistance. Despite weight being an important factor, substantial weight savings in the bike and equipment make quite a small difference to the total weight; it is much easier to significantly affect the predicted speed by changing aspects that affect rolling resistance or air resistance. Drivetrain efficiency is generally very high, but certain equipment choices can be made to improve it slightly. |
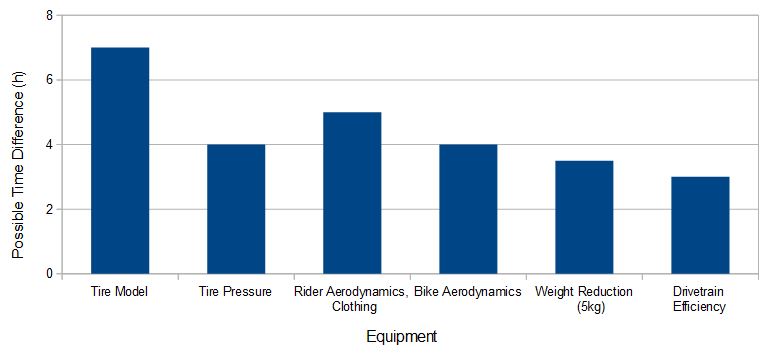
| Tire Model | Choice of tyres is probably the single most important equipment choice because it can have a major effect on cycling speed, although differences in measured rolling efficiency need to be combined with durability and longevity. Possible savings: Up to 7 hours! |
| Tire Pressure | Tires should be kept well inflated. It’s difficult to know whether 80 psi or 120 psi (6 or 8 bars) is more efficient, and this depends on tire width, road surface, etc., but it’s certain that having around 60 psi (4 bars) or less in a road tire will increase the rolling resistance significantly. Possible savings: Up to 4 hours! |
| Air Resistance/Aerodynamics | About 75% of all air resistance is caused by the cyclist, only 25% is due to the bike, so clothing and body position should be optimized before worrying about the aerodynamics of the bike. |
| Air Resistance of the Cyclist | Clothing is very important. A form-fitting jersey, possibly even a one-piece jersey and shorts combination, should be worn if significant time gains are sought. Legs and arms should be shaved. An aero road helmet could also be used (if it is cool enough). Rain jackets should be removed as soon as they are not needed. Possible savings: Up to 5 hours! |
| Air Resistance of the Cyclist | Riding position is very important, affecting speeds on the flat by up to 2 km/h, and even more when there is a headwind. Riding in the drops and on the aerobars is far more aerodynamic than riding on the tops or hoods but requires these positions to be optimized for comfort. |
| Air Resistance of the Bike | The simplest way to improve the aerodynamics of the bike is to use a front tire that is not too wide, a semi-aero’ front rim, and bladed spokes. Using a deeper front rim and a deep rear wheel are also effective options. Aerodynamic frames are an option, but aero-shaped tubes may not make much of a difference when bags, accessories, and bottles are placed everywhere. Possible savings: Up to 4 hours. |
| Air Resistance of the Equipment | The air resistance caused by different types of bags, bottles, etc. is quite important but almost no solid research has been done. The only firm conclusion is that using side panniers should be avoided. Possible savings: Unknown. |
| Weight / Gravitational Resistance | 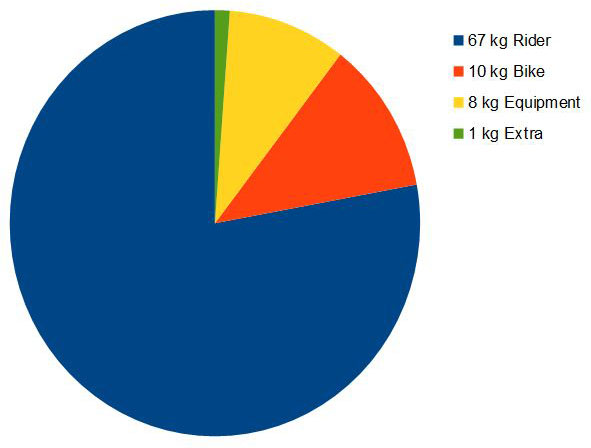 Weight differences should be thought of as the percentage of the total system weight (rider + bike + equipment), not as a percentage of just the bike and/or the equipment. It is difficult to get a large percentage change in total weight: Even a decent absolute change of 1 kg is only a 1.2% reduction in system weight. Possible savings: Up to 40 minutes per kilogram saved (or, less than 3 minutes per day, per kg). Losing weight from your body is free speed (reducing both gravitational resistance and air resistance), but buying lighter equipment is one of the most expensive ways to improve average cycling speed. |
| Weight | Any item that increases weight but improves comfort, improves time-efficiency when off the bike, or improves the reliability of the bike is likely to more than offset the very small decrease in average speed due to the weight. |
| Drivetrain Efficiency | Install a new chain before the race. Apply fresh oil whenever the chain becomes dry. Possible savings: Up to 2 hours. |
| Drivetrain Efficiency | Rear derailleur pulleys that use bushings can be switched for models that contain bearings, either steel or ceramic. Possible savings: Up to 1 hour. |
| Hub Resistance | Using a dynamo front hub instead of a standard hub will cost between 30 minutes and 3 hours depending on the proportion of time that the hub is used to power lights and recharge devices. Most people find this cost to be more than worthwhile due to it allowing them to ride indefinitely without needing to worry about battery charge levels. |
| Wind | The model assumes that wind averages 10 km/h and comes from random directions. If the wind is assumed to be 50% stronger then the predicted average speed is 0.9 km/h slower, causing the cycling time to be 8.5 hours more. |
| Elevation | Climbing speeds are reduced significantly at higher elevations. This should be taken into account when selecting Gear Ratios that can be comfortably pedaled for extended periods on steep gradients in the high mountains. Maximum losses: Sustainable power is about 16% lower at the highest elevation of the 2016 TCR route (2429 m) than at sea level. |
| Air Temperature | Lower temperatures means denser air, so more air resistance, and tire rolling resistance also increases. A temperature decrease of about 5°C can have the same effect on average speed as a 2.5 kg increase in bike weight! |
Discussion
The total savings listed in the table above and summarized in the graph suggest that the difference between using certain equipment and others could total over 26 hours of cycling time for a typical TCR rider, thereby changing the predicted finishing time by well over 2 days! This is even when keeping the weight the same and not considering any changes to riding position. The standard model already includes most of these savings as the default options, so the predicted finishing time of the average-strength rider of 180.5 hours cannot be reduced by that much; instead, it is more likely to be increased if non-optimal setups/equipment is used.
For a completely indepedent analysis that reaches similar conclusions to those presented here, see Dave McCraw’s article on Optimising long distance cycling speed.
Last significant page update: November, 2016
This page is in the What Determines Cycling Speed? section. The next page in this section is: