This page contains a brief introduction to the model used throughout this section to investigate which factors are most important when determining cycling speed. The model is used to predict finish times for cycling a longer and flatter route versus a shorter and more mountainous route. How increasing cycling power affects average cycling speed is also assessed.
Page Contents:
Model of Cycling Speed
The model of cycling speed used in this section uses well-established equations of what determines cycling speeds that are normally used to determine speeds in a specific instant (e.g., see here and here). It goes further by predicting the average speed across an entire route based on gradient and elevation information and a power profile that varies based on those factors. The most similar tools available online are the free but quite basic Bike Calculator, the more powerful Best Bike Split that requires a paid subscription, or Cycling Power Lab which estimates times on pre-defined routes. See this pdf file for a complete description of how the current modeling was done.
Parameter Values
Parameters used in the model are based on observed data from riders who participated in the 2015 Transcontinental Race (TCR) and finished around the middle of the pack. Riding speeds and distances ridden are available on the TrackLeaders website, which is based on rider locations uploaded via a Spot satellite tracker. The tracker data has a number of sources of inaccuracies, so I used data from some individuals’ cycling computers to estimate the corrections needed for the satellite-based data and concluded that the average finisher rode a distance of 4295 km at a speed of about 23.2 km/h.
Power & Weight
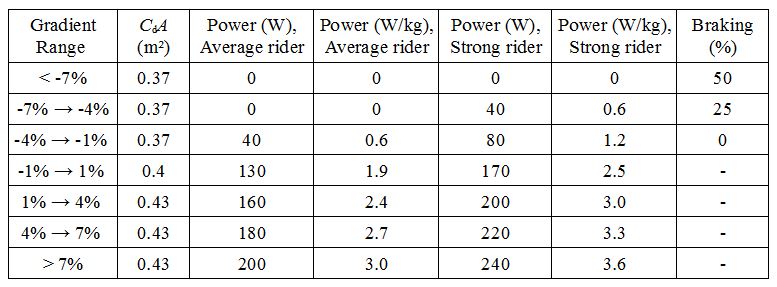
The power profile shown in the table above for an average-strength rider was established to fit the observed average speed of TCR 2015 finishers. How power varies with gradient was determined using information obtained from some participants’ cycling computers and power meters. The second power profile is intended to represent a reasonably strong TCR rider and was created by simply adding 40 watts to each value of the average-strength rider.
The default total weight used in the simulations is 85 kg, which may consist of a 67 kg rider (which is the weight used to calculate the watts per kg measure above), plus a bike that weighs 10 kg when fully equipped for the TCR (with aerobars, lights, mounts, etc.) and 8 kg worth of equipment (including food and drink).
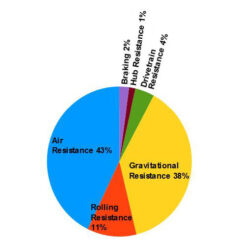
Air Resistance & Braking
Air resistance values (measured as CdA) were used that fit detailed real-world power and speed data from typical TCR riders reasonably well and based on the assumption that cyclists tend to adopt a more aerodynamic position when descending, much less so when climbing, and an intermediate position on flat sections. The effect of using different riding positions on cycling speed is looked at in detail on the Air Resistance of the Cyclist page.
The braking values given in the right-hand column of the table were selected so that the observed average speeds on descents could be predicted more accurately, because otherwise the predicted speeds were too high. In reality, this may be more due to the model assuming that a terminal velocity is reached immediately when descending than it being due to the rider braking so much.
Moving Percentage & Routes
To convert the total cycling times predicted by the model to finishing/elapsed times, I again used the observed data recorded with the satellite trackers. People appeared to spend an average of about 12 hours and 10 minutes out of every 24 hours on the bike during the race. The predicted cycling times were therefore simply doubled to get the predicted race finishing times.
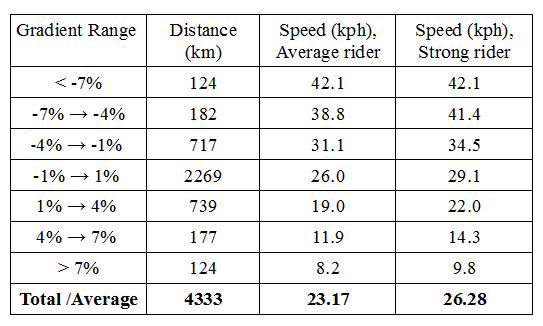
The routes used to simulate the 2015 and 2016 Transcontinental Races were not optimized for any specific characteristic. That is, they were not the shortest, flattest, fastest, or most scenic; they were instead chosen to be generally representative of what many people did. The route used to simulate the 2015 Transcontinental Race (TCR) was 4333 km long and has about 38,000 meters of climbing. The 3899 km long 2016 route is 434 km shorter but the 55,000 meters of climbing is about 17,000 meters more.
Results & Discussion
TCR 2015 Route
The average finisher in the 2015 race had an observed average speed of 23.2 km/h. The model was fit to match this, and so the total predicted cycling time was 186 hours 20 minutes. Assuming that the rider would spend 12 hours per day on the bike gives a predicted finishing time of about 15 days and 13 hours, which would have put the simulated person in 40th place out of the 89 finishers, having ridden about 280 km per day.
TCR 2016 Route
The same parameter values were used to predict the finish times for the 2016 TCR. The first question is therefore whether a rider with the same power profile would complete the 2016 route faster than the 2015 route, all other things being equal. The answer is yes, and by about half a day!
The average-strength rider is expected to have a 1.6 km/h slower average speed of 21.6 km/h on the 2016 route, but the expected total cycling time is about 6 hours less than in 2015, at 180 hours 31 minutes. This translates to 15 days, 1 hour, and 2 minutes of race time, having ridden about 260 km per day. The race started at 22:00 (CET) in Belgium on July 20th, 2016, and the finish party, which most mid-pack riders set as their goal to finish in time for, finished at 00:00 (EET) on August 14th in Turkey. Unfortunately, the average-strength rider is expected to finish just 2 minutes after the finish party ends! Hopefully in the real-world such a rider would have enough energy to sprint towards the finish line to arrive just in time to collect the coveted Maglia Nera prize.
Effect of Increasing Power
The average overall power (including descents) is about 165 watts for the stronger rider and 130 watts for the average rider, which is a difference of about 28%. This increase in power causes the stronger rider to cycle at an average speed of about 3 km/h faster than the average-strength rider over both the 2015 and 2016 routes, an increase of about 14%. The much smaller relative increase in speed (14%) than in power (28%) is due to the non-linear increase of air resistance with increasing cycling speeds.
On sections of the route that involve more climbing, air resistance becomes less important, so the average speed increases more linearly for a given increase in power. For instance, in the 700 km-long section of the 2016 route that passes through the Alps from Interlaken, Switzerland to Slovenia, the stronger rider averages 24% more power and has a 15% higher speed than the average-strength rider. This explains why the observed pattern that cyclists tend to exert more power on climbs than on flat roads and even less on descents is rational, because it optimize the average speed for a given total energy expenditure.
Last significant page update: November, 2016
This page is in the What Determines Cycling Speed? section. The next page in this section is: