There are several environmental factors that affect cycling speed in addition to the more typically-studied factors like power and weight. This page covers how wind, elevation and temperature affect predicted cycling speeds because although these factors cannot be directly controlled, understanding their effects can be useful.
Page Contents:
Wind
Method
The model of cycling speed used in all of the modelling presented in this section assumes that the wind is equally likely to be 0, 5, 10, 15, or 20 km/h, and so averages 10 km/h, and is equally likely to come from all directions. These are reasonable assumptions given the typical conditions across most of the 2016 Transcontinental Race (TCR) route in the summer. More information about how the simulations were performed is on the General Method page.
Results
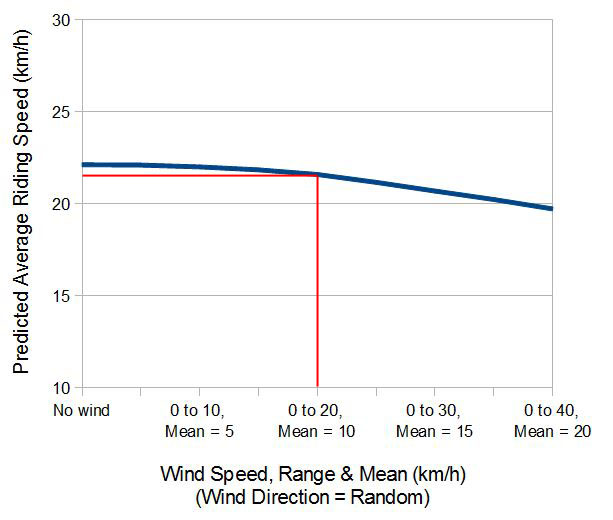
The figure below shows the predicted average speed for different strengths of wind that are all equally likely to come from all directions. The red line shows the default condition in which the predicted average speed for an average-strength rider is 21.6 km/h. Because the effect of wind is non-linear, assuming that there is no wind at all causes the average predicted speed to be 0.5 km/h faster, at 22.1 km/h. If the wind was assumed to be 50% stronger, so averaging 15 km/h, but still equally likely to come from all directions then the predicted average speed would decrease by 0.9 km/h, and the total riding time would be 8.5 hours more, or a predicted finishing time that is 17 hours later.
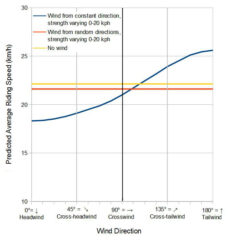
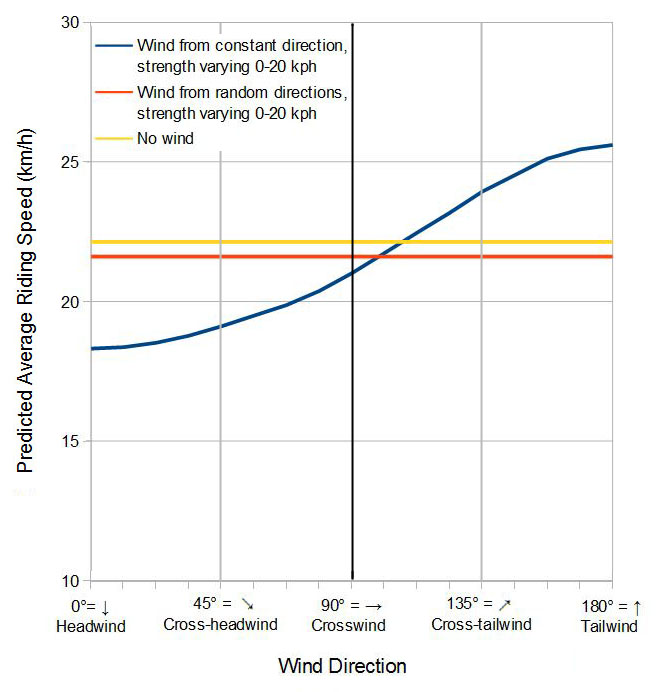
What if the wind came from a consistent direction? This is shown by the blue line in the figure below, with the strength again assumed to vary between 0 and 20 km/h (average = 10 km/h). The red line again shows the default condition, with the wind direction varying randomly. The yellow line shows what would be predicted if there was never any wind. The black vertical line marks a pure crosswind (90° offset from the cyclist’s heading). Pure crosswinds cause extra air resistance because the cyclist must travel through more air than when there is no wind, and so the predicted speed is slightly lower; this is explained more fully by Jobst Brandt. The figure also shows the effect of a pure headwind (on the left, a wind angle of 0°) and a pure tailwind (on the right, 180°).
Discussion
In the real world, most cyclists tend to pedal harder when battling against a headwind than when assisted by a tailwind. Data for this is difficult to obtain because most bike computers don’t record wind information (except for the iBike Newton). The model therefore includes the simplifying assumption that the cyclist’s power is only affected by the gradient of the road and is independent of wind conditions. In the Weather subsection of the page about Schedule & Goals, I discuss using the current wind forecast to choose between possible route options and when to ride versus rest.
Elevation
Much of the 2016 TCR route is at an elevation well above sea level, with the highest point being the Furka Pass in Switzerland at 2429 meters (7969 ft) elevation. The route used for the modeling actually goes above 1700 meters (5500 feet) on thirteen separate occasions. It is therefore important to understand how elevation affects cycling speeds.
Method
Elevation has three separate effects on riding speeds due to atmospheric factors, each of which is included in the model. Most people know that temperature decreases as altitude/elevation increases, the rate is typically 0.65°C for every 100 meters gained. One effect this has on cycling speeds is that tires have more Rolling Resistance when the temperature is lower, increasing by about 1.4% for every 1°C lost. The air is not only cooler at higher elevations, it is also significantly less dense, the difference in density being about 0.8% for every 100 meters gained, which causes cyclists to move faster for the same amount of power exerted. Finally, there is less oxygen available as the elevation increases, which reduces the power that a cyclist can exert, with about 0.6% power lost for every 100 meters according to the formula given by Bassett et al. (1999)1 (see this Training Peaks article).
Results
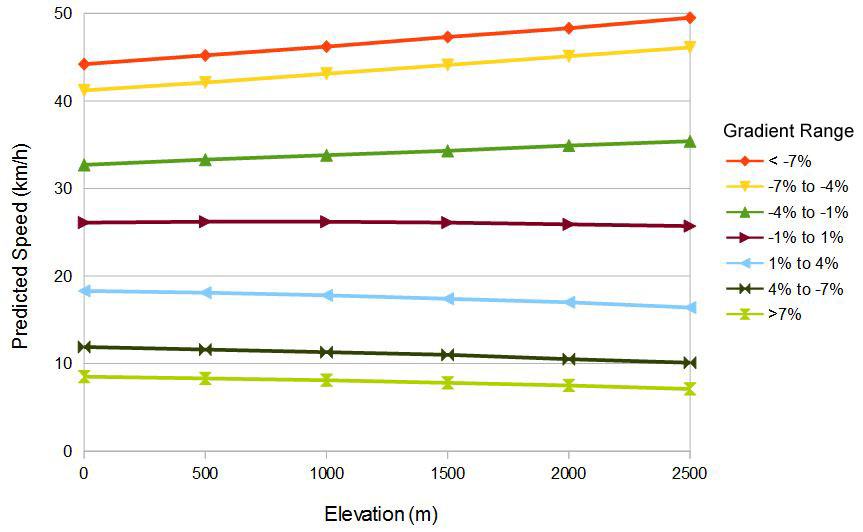
On flat roads, these three effects mostly cancel each other out at the levels of power that bikepackers typically produce so that the predicted speed is similar at 2000 meters elevation on a flat road as it is at sea level, although above that it does start to decrease slightly. On climbs, the reduced power due to the lack of oxygen can become very significant, with 16% less power being available at the top of the Furka Pass than at sea level, and so the expected speed on steeper climbs decreases by the same amount. Even at 1000 meters elevation, 5% less power should be expected than at sea level. On descents, the air resistance is the most important factor, so higher maximum speeds are easier to achieve at higher elevations than at sea level due to the change in air density. These effects are shown in the figure below.
Discussion
When deciding what minimum gearing is needed so that a comfortable cadence can be maintained on the most difficult parts of a route, not only the gradient should be considered, but also the elevation at which those gradients will be experienced. This topic is discussed further on the Gear Ratios page.
As well as having less power available due to the reduced oxygen at higher elevations, it also takes longer for the body to recover from intense efforts in those conditions, so it’s better to never push too hard when at higher elevations. In addition, resting and recovering is less effective at higher elevations due to the reduced oxygen levels, so when it’s convenient I recommend descending as much as possible before stopping to sleep at night.
Temperature
Method
The default condition of the model assumes that the temperature at sea level is a constant 25°C, and the temperature only changes as a result of elevation changes. 25°C is a plausible average temperature during the TCR due to the time of year, the regions that are ridden through, and TCR riders ride more during the day than at night. But how much difference would there be in the expected speeds if the temperature was 5°C colder or warmer?
Results & Discussion
A lower temperature results in denser air, meaning increased air resistance, and also causes tire rolling resistance to increase. It is therefore no surprise that predicted speeds are slightly lower when the temperature is lower, and the difference is about 0.2 km/h for a 5°C decrease. This is true for both the average-strength and strong riders. If there is a heatwave and temperatures are 5°C warmer then riding speeds would be predicted to be about 0.2 km/h faster, but it is widely established that people cannot maintain the same level of power when the air temperature becomes uncomfortably high, so in reality observed speeds may actually be lower if the average temperature was that high (30°C).
Last significant page update: November, 2016

This is the final page in the What Determines Cycling Speed? section, which is in Ride Far, Part II: The Bike.
1 Bassett, D.R. Jr. et al. (1999). Comparing cycling world hour records, 1967-1996: modeling with empirical data. Medicine and Science in Sports and Exercise, 31, 1665-76.